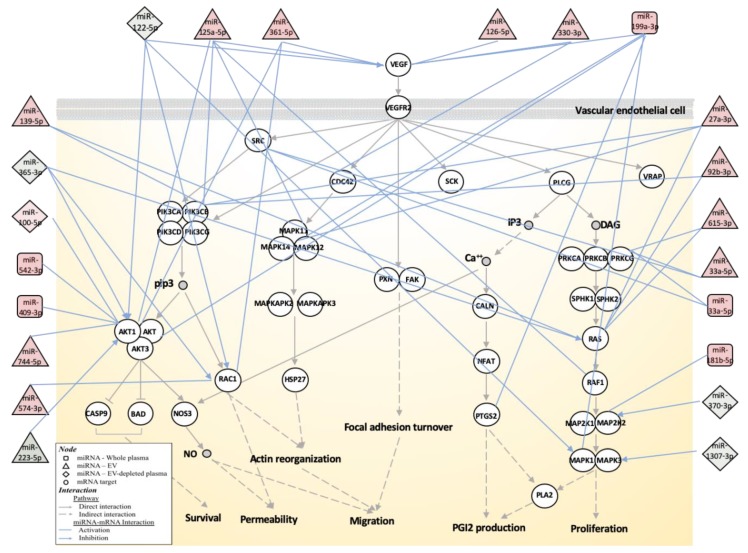
Figure 3.
Schematic diagram of mRNA-miRNA interactions associated with the vascular endothelial growth factor (VEGF) signaling pathway. The network is built based on the VEGF signaling pathway map (hsa04370) from the Kyoto Encyclopedia of Genes and Genomes (KEGG), identified by enrichment analysis of miRNA targets. The genes are represented by circles and miRNAs are by squares (whole plasma), triangles (EV) and diamonds (EV-depleted plasma). The identity of genes and miRNAs involved in the process are indicated. The miRNA concentration changes in MMD patients are reflected by either red- (increased concentration in MMD) or green- (decreased concentration in MMD) filled shapes. The miRNA–mRNA interactions are based on validated gene targets from miRTarBase and indicated by light blue lines.

