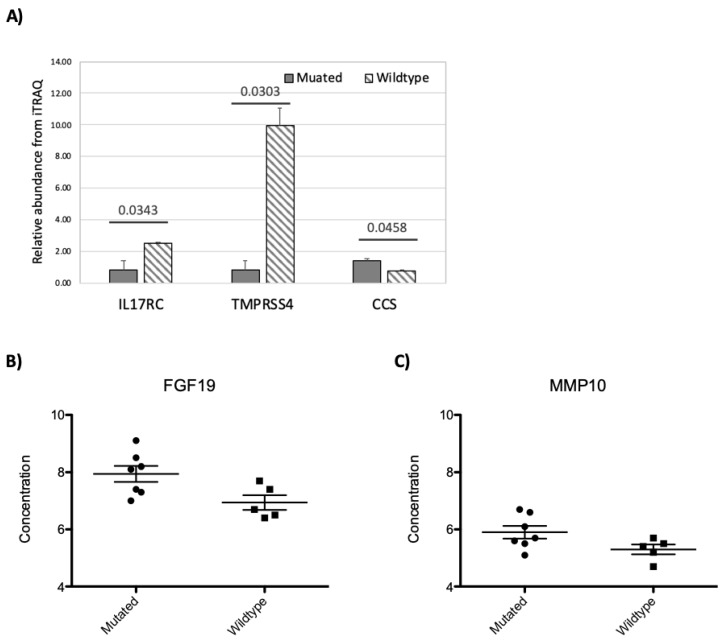
Figure 5.
The impact of RNF213 mutation on plasma proteome measured by iTRAQ (A) or PEA (B,C). The bar graph (iTRAQ) scatter plots (PEA) of proteins showing concentration changes associated with RNF213 mutation. For iTRAQ (A), the protein IDs are indicated on the X-axis, the p-values and sample groups are indicated on top of the bar graph. For PEA data (B and C), sample groups are indicated on the X-axis and the protein abundance is indicated on Y-axis. The protein identity is indicated on top of the figures.

