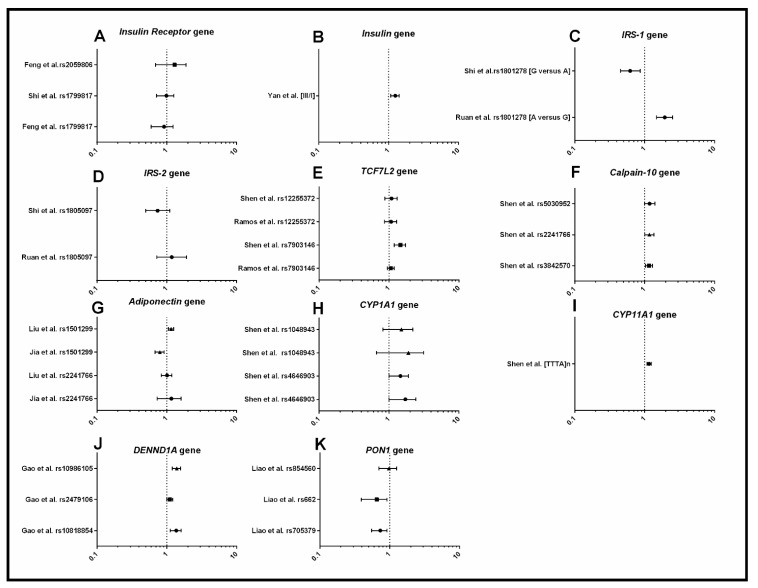
Figure 3.
Forest plots representing the association between metabolic SNPs and PCOS under the allele model. (A) Insulin receptor; (B) Insulin gene variable number of tandem repeats (INS-VNTR); (C) Insulin Receptor Substrate-1 (IRS-1); (D) Insulin Receptor Substrate-2 (IRS-2); (E) Transcription Factor 7-Like 2 (TCF7L2); (F) Calpain-10; (G) Adiponectin; (H) Cytochrome P450 Family 1 Subfamily A Member 1 (CYP1A1); (I) Cytochrome P450 Family 11 Subfamily A Member 1 (CYP11A1); (J) DENN domain containing 1A (DENND1A); (K) Paraoxonase 1 (PON1). The circle represents the odds ratio (OR) and the horizontal lines are the 95% confidence intervals (CI).

