Figure 2.
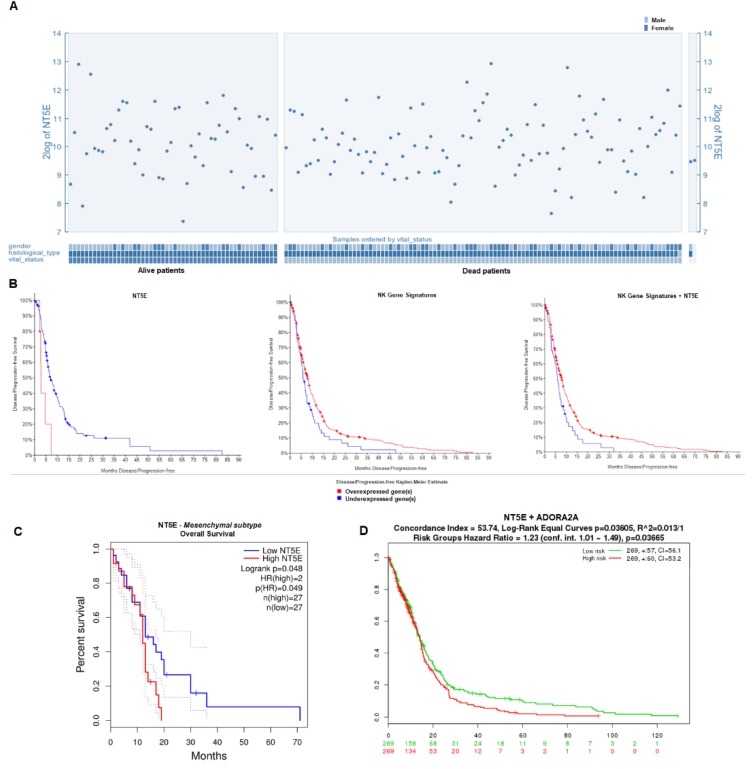
Survival analysis in the context of NT5E and natural killer (NK) gene signature expression. (A) Expression of NT5E in GBM patient samples plotted on the basis of patient vital status. Analysis was done in R2 (n = 540). (B) Disease-free survival of GBM patients on the basis of NT5E expression level from TCGA RNASeq V2 RSEM data (p = 0.0039; z = 2; left; n = 166); NK gene signatures comprising 13 NK-specific genes from U133 Affymetrix gene expression data (p = 0.0285; middle panel); and both NT5E and NK gene signatures from U133 Affymetrix gene expression data (p = 0.0109; right). Kaplan–Meier plots were generated in cBioPortal (n = 533). (C) Overall survival of GBM patients with the mesenchymal subtype based on NT5E expression. Analysis was done in GEPIA2 (n = 163). (D) Overall survival stratified by risk group for patients expressing NT5E and ADORA2A. Analysis was done in R2.

