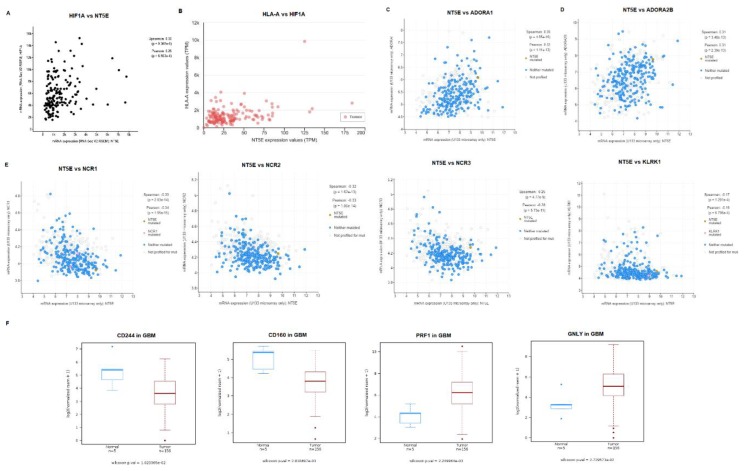
Figure 3.
Correlation of expression of NT5E and NK gene signatures in GBM. (A) Co-expression of NT5E and HIF1A in GBM. Data were analyzed in cBioPortal using U133 Affymetrix microarray data (z = 1; n = 533). (B) Co-expression of NT5E and HLA-A based on TCGA data in UALCAN (n = 156). (C) Co-expression of NT5E and ADORA1 in GBM using the TCGA database analyzed in cBioPortal on the basis of U133 Affymetrix microarray data (z = 1; n = 533). (D) Co-expression of NT5E and ADORA2B in GBM using the TCGA database analyzed in cBioPortal on the basis of U133 Affymetrix microarray data (z = 1). (E) Co-expression of NT5E and genes representing NK activating receptors: NCR1, NCR2, NCR3, and KLRK1 in GBM. Data were analyzed in cBioPortal using U133 Affymetrix microarray data (z = 1). (F) Box-plots of the expression of genes associated with NK cells in GBM (red) and normal tissue (blue): CD244, CD160, PRF1 and GNLY based on TCGA data analyzed in TCGA Wanderer (n = 156).

