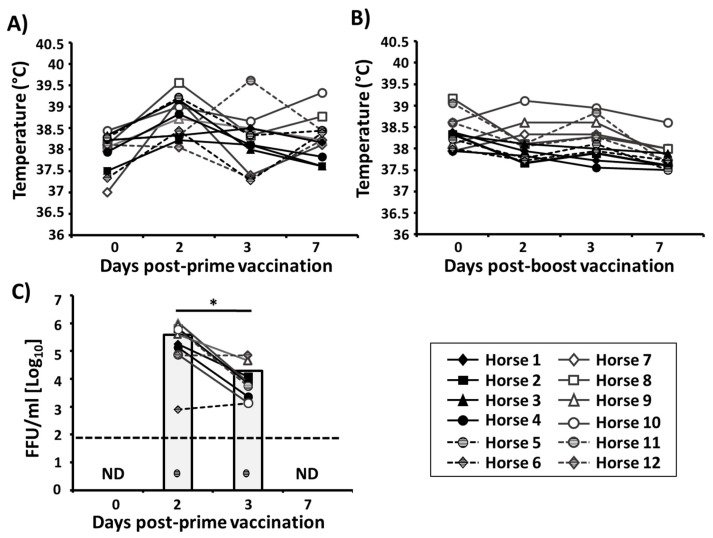
Figure 6.
Attenuation of the bivalent EIV LAIV in horses: (A,B) Graphical representation of the rectal temperatures in vaccinated horses (n = 12) before (day 0) and 2, 3, and 7 days after prime (A) and boost (B) vaccination with the bivalent EIV LAIV. Data represent the rectal temperature of each horse which representative symbol is indicated at the bottom-right. (C) Viral titers: Nasopharyngeal swabs from vaccinated horses (n = 12) were collected on days 0, 2, 3, and 7 days after prime vaccination. Virus content was determined by immunofocus assay (FFU/mL). Individual results for each horse are represented. Bars indicate the mean of the results determined in the 12 horses. ND, not detected. Dotted black lines indicate the limit of detection (200 FFU/mL). Striped black circles below the limit of detection represent non-detected virus, horse 5. * p < 0.05 was considered statistically significant.

