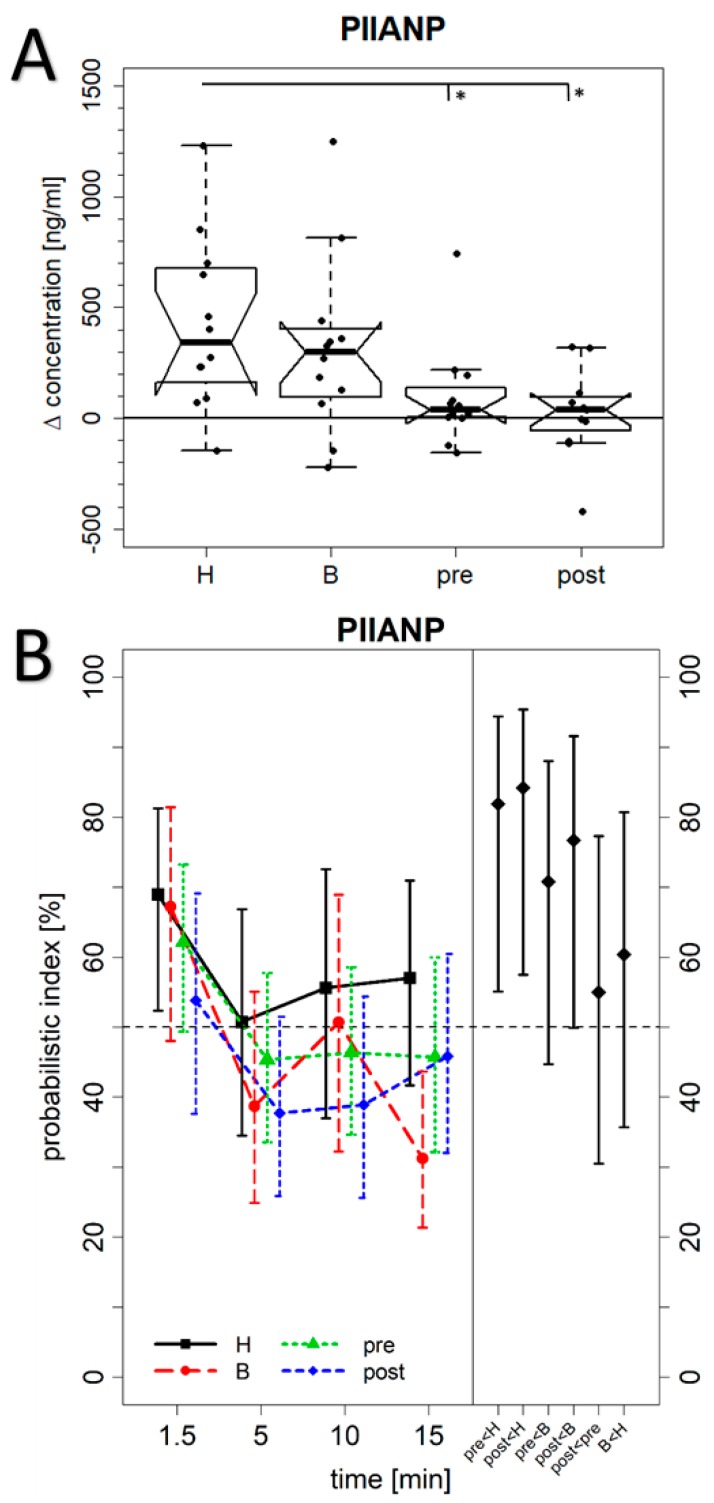
Figure 2.
Serum concentration of PIIANP. (A) The difference between the maximum biomarker concentrations within the first 15 min after exercising of the hand and finger joints and the PIIANP level at baseline before exercising (H = cohort of patients with more Heberden-accentuated hand OA (p = 0.0024, n = 12); B = cohort of patients with more Bouchard-accentuated hand OA (p = 0.012, n = 12); pre = premenopausal control group (p = 0.09, n = 12); and post = postmenopausal control group (p = 0.64, n = 12)). Data are presented as notched boxplots with the X-axis at 0 indicating no altered concentration when compared with the time-point before exercising of the hand. The asterisks mark the statistically significant differences. (B) The estimated marginal probabilistic indices (PIs) of PIIANP concentrations for each cohort and time point (left, solid symbols connected by polylines of same type and color, augmented by pertaining pointwise 95% confidence intervals as vertical segments) and the estimated summarized PIs for all pairs of cohorts (right, black diamonds, with pairs of cohorts indicated on the horizontal axis) together with their pointwise 95% confidence intervals.

