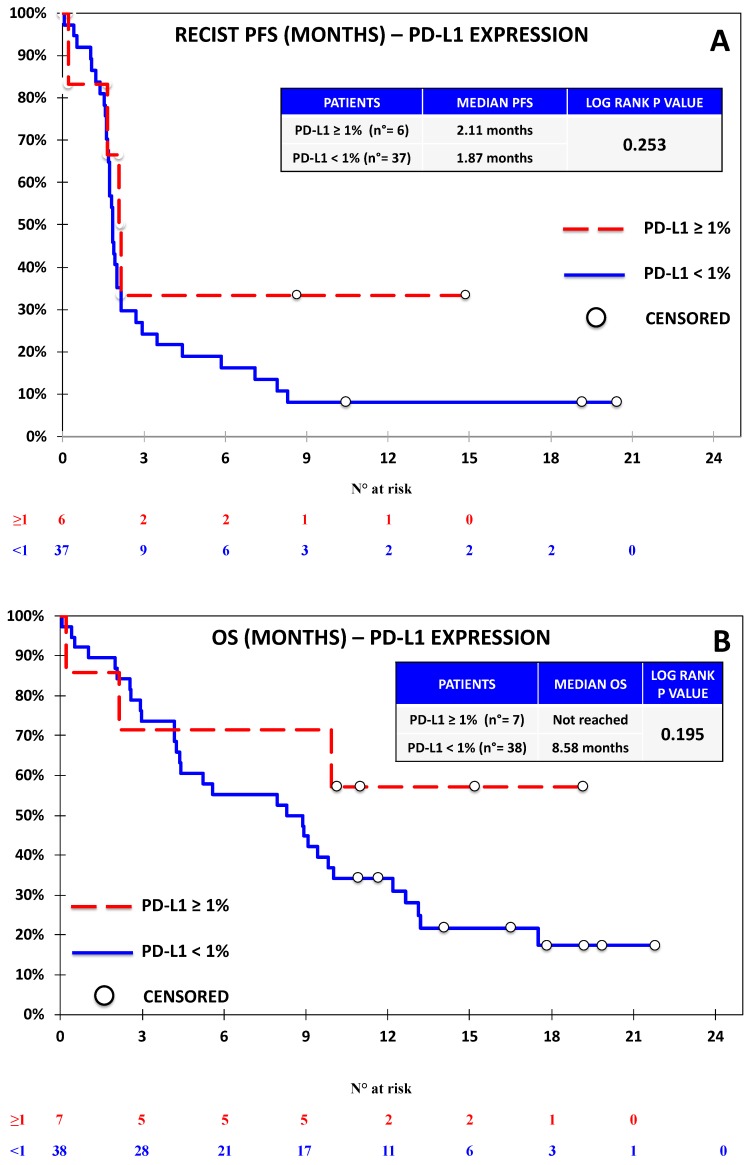
Figure 2.
Kaplan–Meier curve for Response Evaluation Criteria in Solid Tumors (RECIST)-progression-free survival (PFS) (A) and overall survival (OS) (B) based on the expression of PD-L1 defined as ≥1% vs. <1% in the Nivolumab Cohort. No significant difference was observed on the basis of PD-L1 expression.

