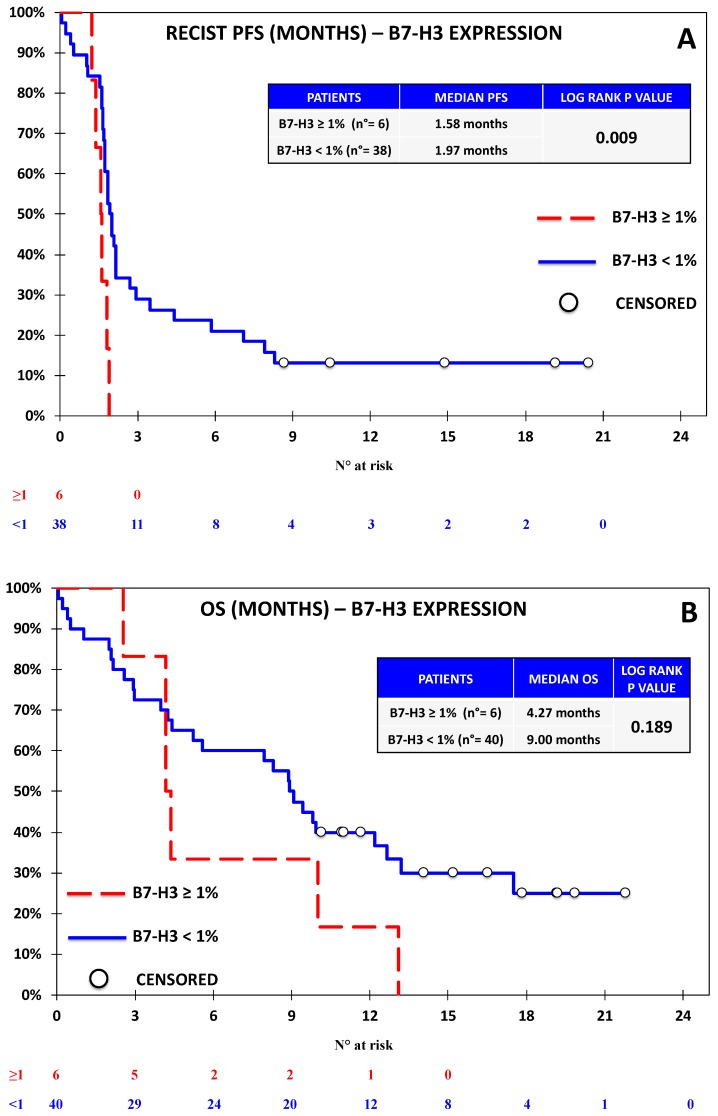
Figure 5.
Kaplan–Meier curve for RECIST-PFS (A) and OS (B) based on the expression of B7-H3 defined as ≥1% vs. <1% in the Nivolumab Cohort. B7-H3 expression was associated with significantly lower RECIST-PFS and no significant difference in terms of OS. While these results should be considered with caution due to the fact that only six out of 44 patients expressed B7-H3, the rapid progression and death of all the B7-H3-expressing patients was noteworthy. Notably, all the patients who were alive at the time of the analysis did not express B7-H3.

