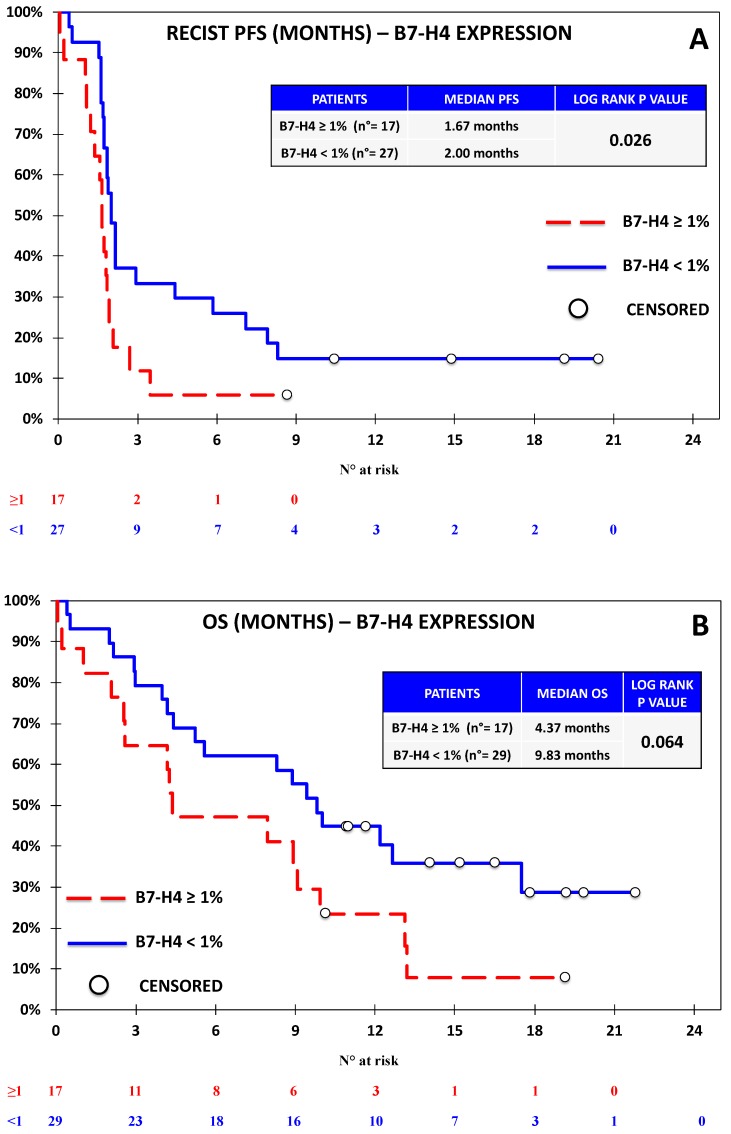
Figure 6.
Kaplan–Meier curve for RECIST-PFS (A) and OS (B) based on the expression of B7-H4 defined as ≥1% vs. <1% in the Nivolumab Cohort. The expression of B7-H4 was significantly associated with shorter PFS and non-significantly associated with shorter OS, although the difference was close to significance (p-value = 0.064).

