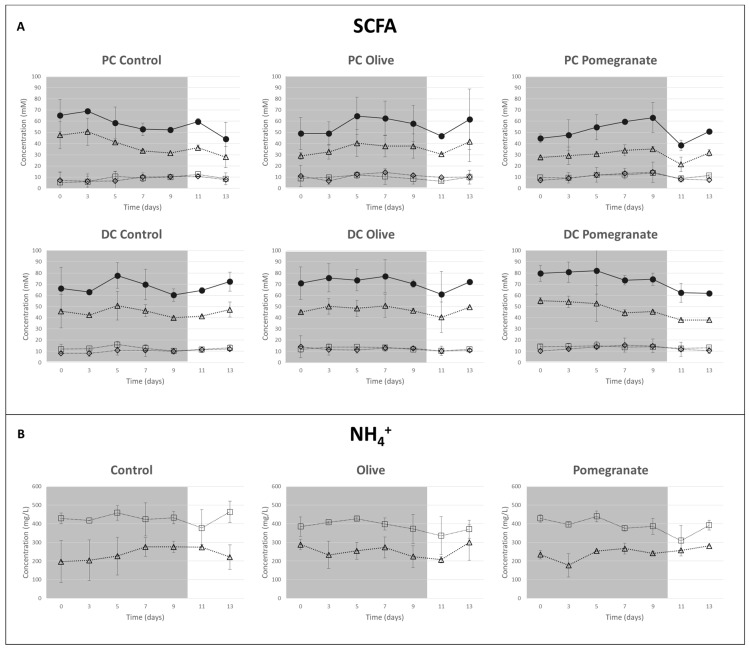
Figure 2.
(A) Short chain fatty acid (SCFA) levels during and after treatment in PC and DC from control, OP- and PM-treated vessels in terms of acetate (∆), propionate (□), butyrate (◊), and total SCFA (●). (B) NH4+ levels during and after treatment in PC (□) and DC (∆), from control, OP-, and PM-treated vessels.

