Figure 1.

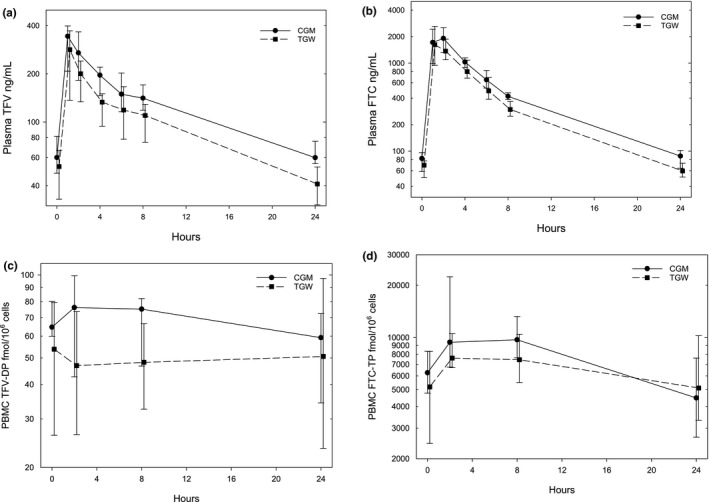
Concentration versus time plots for plasma tenofovir (TFV, a) and emtricitabine (FTC, b), and peripheral blood mononuclear cell (PBMC) TFV diphosphate (TFV‐DP, c) and FTC triphosphate (FTC‐TP, d) comparing transgender women (TGW; dashed lines, squares) and cisgender men (CGM; solid lines, circles). Data are medians with error bars indicating lower and upper quartiles. Time values are slightly offset to avoid overlap of data.
