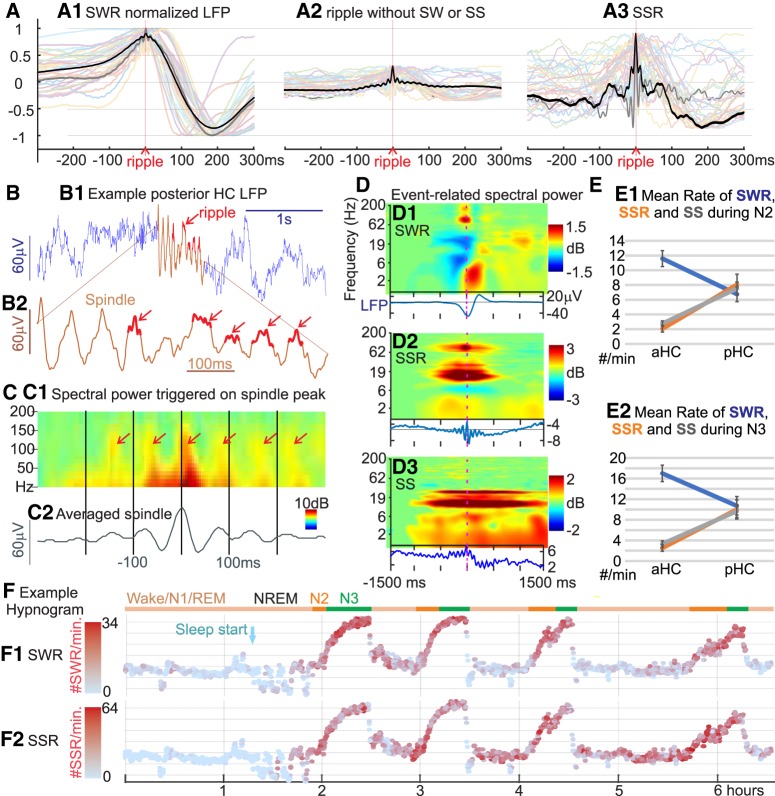
Figure 1.
HC-SSs coordinate ripples and are found predominantly in pHC. A, Overlaid average waveforms of HC-SWR (A1), of ripples not coupled to sharpwaves (A2), and of HC-SSR (A3) across hippocampal contacts from 32 different patients, with one representative patient bolded in black for clarity. The non-normalized, across-patient mean LFP peak-to-peak amplitude of the sharp wave (A, black trace) is 127.1 μV, much greater than the corresponding peak amplitudes of 8.284 and 14.79 μV in B and C, respectively. B, Example LFP trace of a ∼14 Hz HC-SS (red section) from bipolar recording in the pHC (B1), with expanded time-base plot of the spindle shown in B2; 80–90 Hz ripples occur preferentially at some peaks of the spindle waves. C, Example averaged time-frequency plot triggered on the center peak of HC-SSs from the same channel in B (C1, n = 1086) and the corresponding average LFP (C2). D, Event-related spectral power is contrasted for SWRs (D1), SSRs (D2), and SSs (D3) from the same HC site, with corresponding average LFP traces below the time-frequency plots. The high-frequency ripple burst is seen for SWRs and SSRs but not prominently so in SSs. Prolonged spindle activity is seen for SSRs and SSs but not SWRs. E, HC-SWRs preferentially occur in aHC, whereas HC-SSs/SSRs prefer pHC. Each panel marks mean rates of HC-SWR/SSR/SS occurrence across patients in N2 (E1) or N3 (E2), for aHC and pHC. F, Example state plots showing the separation of NREM sleep Stages N2 and N3 from waking/N1/REM in ∼6.5 h LFP recording, using the first principal component derived from vectors (one per cortical bipolar SEEG channel) of frequency power ratios (0.5–3 Hz over 0.5–16 Hz) (Gervasoni et al., 2004; Jiang et al., 2017). SWR rate (F1) and SSR rate (F2) are color coded with red intensity, and N2/N3 periods are marked with orange/green horizontal lines, respectively. Light blue arrow indicates the beginning of NREM sleep. Similar illustration for HC-SSs rate over time can be found in Extended Data Figure 1-1. E, Error bars indicate SEM.

