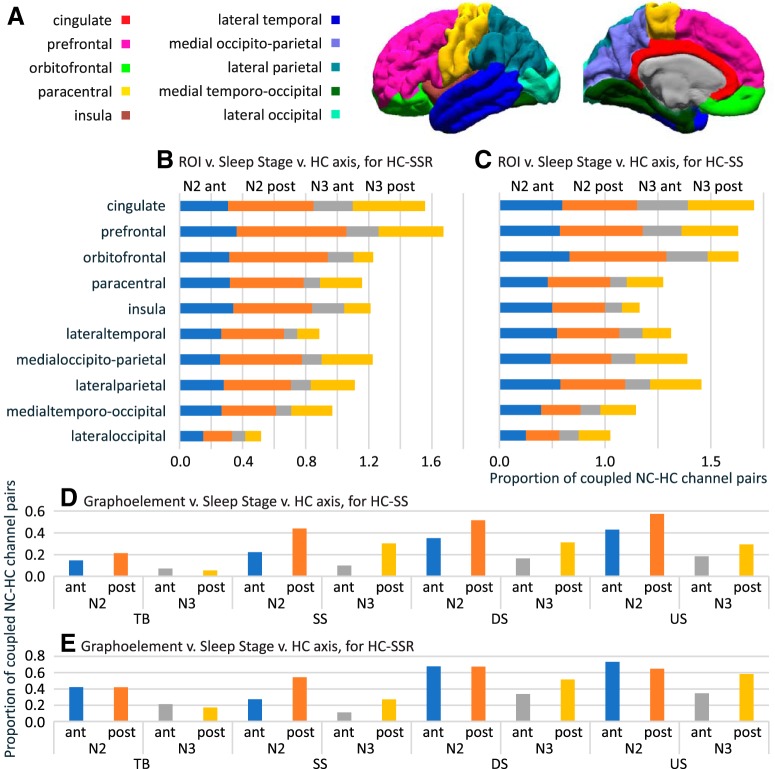
Figure 5.
Strength of HC-NC association shows both correlativity and variability across GE types, NREM stages, HC-SS/SSR sources, and NC regions. A, Map of NC ROIs used for analysis (Extended Data Table 4-1). B, C, Stacked bar graph of mean significant (evaluated as in Fig. 3) HC-NC channel pair proportions with regard to all channels found in each ROI. B, Data were obtained by averaging across GE types for each SSR origin (different NREM stages and HC contact positions). C, Similarly, data were obtained by averaging across NC-GE types for each HC-SS origin. D, E, Global (i.e., across all NC ROIs) proportions of significant HC-NC channel pairs for HC-SSRs (D) and for HC-SSs (E). B–E share the same color legend. ant, aHC; post, pHC.

