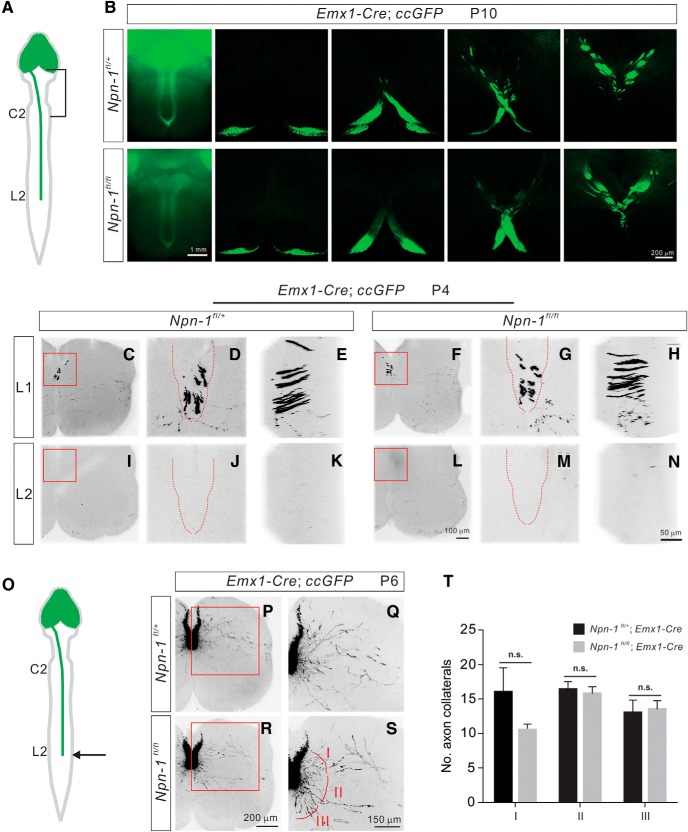
Figure 3.
Normal elongation and branching initiation of CS axons in Npn-1fl/fl; Emx1-Cre mice. A, Schematic diagram showing labeling in the forebrain as well as descending CS axons by Emx1-Cre; ccGFP. B, Ventral views of the brainstem and coronal sections show CS axons labeled by GFP in Npn-1fl/+; Emx1-Cre; ccGFP (control; top) and Npn-1fl/fl; Emx1-Cre; ccGFP (bottom) mice at P10 are similar in both groups. The dorsal turning and midline crossing of CS axons in Npn-1fl/fl; Emx1-Cre; ccGFP mice were similar to control mice. C–H, Images of the L1 lumbar spinal cord from Npn-1fl/+; Emx1-Cre; ccGFP (C–E; control) and Npn-1fl/fl; Emx1-Cre; ccGFP (F–H) mice at P4 show that the arrival of CS axons at L1 is similar in both groups. Front views (D, G) and side views (E, H) are from the red boxed areas in C, F. Dorsal columns are indicated by red dashed lines in D and G. I–N, Images of the L2 lumbar spinal cord from Npn-1fl/+; Emx1-Cre; ccGFP (I–K; control) and Npn-1fl/fl; Emx1-Cre; ccGFP (F–H) mice at P4 show the absence of CS axons at L2 in both groups. Front views (J, M) and side views (K, N) are from the red, boxed areas in I and L. Dorsal columns are indicated by red dashed lines in (J, M). O, Schematic diagram showing labeling in the forebrain as well as descending CS axons by Emx1-Cre; ccGFP at P6. CSNs begin to send out primary axon shafts at this stage. P–S, Images of the L2 lumbar spinal cord from Npn-1fl/+; Emx1-Cre; ccGFP (P–Q; control) and Npn-1fl/fl; Emx1-Cre; ccGFP (R–S) mice at P6 showing the formation of primary axon shafts in both groups. Q, S, High-power views of the red boxed areas in P and R. The primary axon shafts are divided into three groups based on the orientation of their projections (I, dorsal; II, medial; III, ventral). T, Quantification of the axon collaterals in zones I (p = 0.1950), II (p = 0.6826), and III (p = 0.8295) showed that the numbers of axon collaterals were similar between Npn-1fl/+; Emx1-Cre; ccGFP) and Npn-1fl/fl; Emx1-Cre; ccGFP mice. Scale bars: B, 1 mm; N, 50 μm; R, 200 μm; S, 150 μm. n.s. = not significant.

