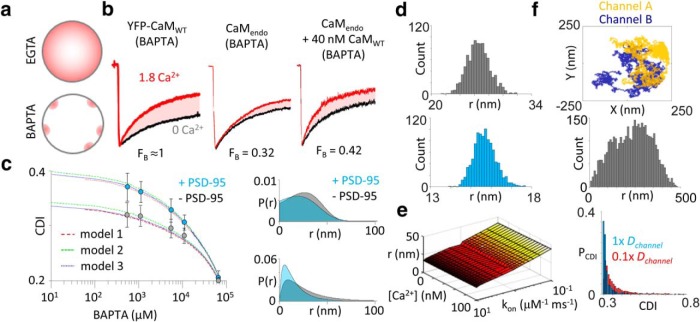
Figure 6.
PSD-95 decreases the effective coupling distance between NMDA receptors. a, Schematic of intracellular Ca2+ concentration gradients (pink) during whole-cell recordings in weak buffering (EGTA) and strong buffering (BAPTA) conditions. Restricting Ca2+ elevations within local nanodomains of the source reveals the fraction of channels preassociated with CaM. b, Representative whole-cell current from GluN1-2a/GluN2A and with YFP-CaMWT (left), with CaMendo or with 40 nm purified CaMWT (right). c, Left, CDI measurements in cells either lacking (gray) or coexpressing (blue) PSD-95 and with increasing concentrations of intracellular BAPTA. Three variants of Equation 22 were fit to the data: model 1, r is constant; model 2, r is a skewed Gaussian distribution; and model 3, r is a weighted exponential distribution. Right, Hypothetical distributions of effective channel coupling distance predicted by models 2 (top) and 3 (bottom) using the parameter values determined from the fit. d, The statistical error of coupling distance parameter (r) estimation from the fits was determined by generating 1000 artificial datasets using a bootstrap procedure and analyzing these sets as the original by fit with generalized model. Histogram of coupling distances, r, of bootstrap analysis from cells not expressing (top) and expressing (bottom) PSD-95. e, Systematic error of the model was evaluated by systematically changing model parameter (BAPTA kinetics, kon, and free basal Ca2+) values over two orders of magnitude. f, Monte Carlo simulation of lateral diffusion of channels within patch pipette. Top, Trajectories of two channels explored by lateral diffusion during a cell-attached patch-clamp experiment. Middle, Distribution of interchannel distances during patch-clamp recording. Bottom, Distribution of predicted CDI values calculated with Equation 22. The probability of CDI [P(CDI)] during single-channel recordings follows an exponential distribution as a result of lateral diffusion. Reduction of the diffusion coefficient (Dchannel) shifts the distribution toward stronger CDI magnitudes.

