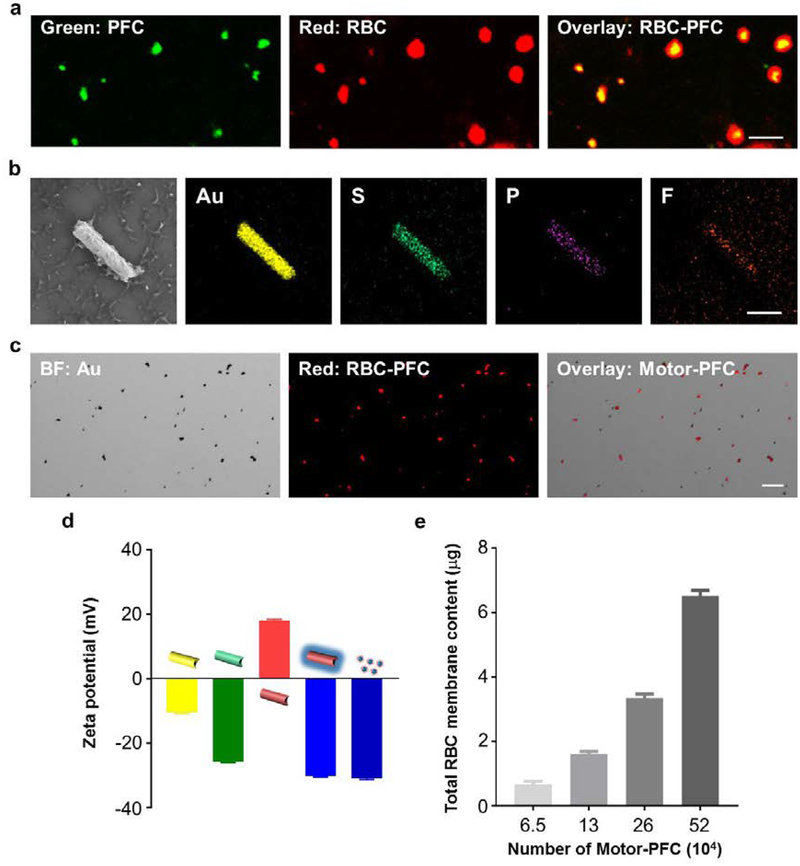
Figure 2. Structural characterization of Motor-PFC.
(a) Confocal fluorescence imaging of dual-labeled RBC-PFC; the RBC membrane was labeled with DiD (red), and the PFC core was labeled with BODIPY (green). Scale bar: 500 nm. (b) Scanning electron microscopy (SEM) image of a Motor-PFC and corresponding Energy-dispersive X-ray spectroscopy (EDX) analysis showing the distribution of Au (yellow), S (green), P (purple) and F (orange). Scale bar, 1 μm. (c) Bright-field, fluorescent and merged images of a group of Motor-PFC; the RBC membrane was labeled with DiD to help visualization (red). Scale bar, 10 μm. (d) Zeta potential of sequential modification of Motor-PFC (from left to right): bare AuNW, MPA-modified AuNW, PLL-modified AuNW, RBC-PFC bound AuNW and free RBC-PFC (n=3, mean ± s.d.). (e) Total RBC content on different numbers of Motor-PFC, measured by lipoprotein content from RBC membrane (n=3, mean ± s.d.).

