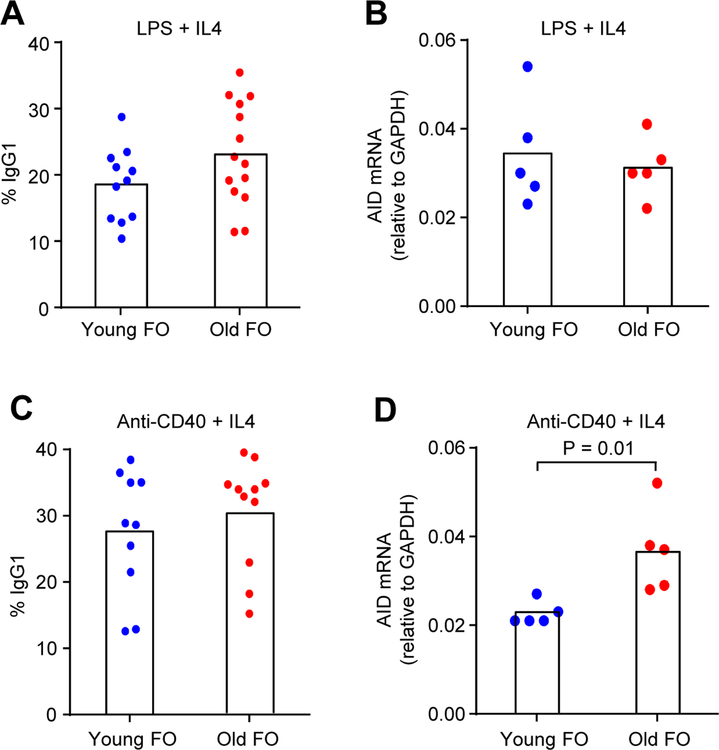
Fig. 3.
IgG1 and AID expression in young and old FO cells after 3 days stimulation. AID transcripts were measured by qPCR [26] and normalized to GAPDH. (A) and (B), stimulated with LPS and IL4. (C) and (D), stimulated with anti-CD40 and IL4. Each symbol represents a mouse, with the mean number of switched cells and AID expression indicated by a column (n = 5–14 mice for each age). Significance was determined by a two-tailed Student t test.

