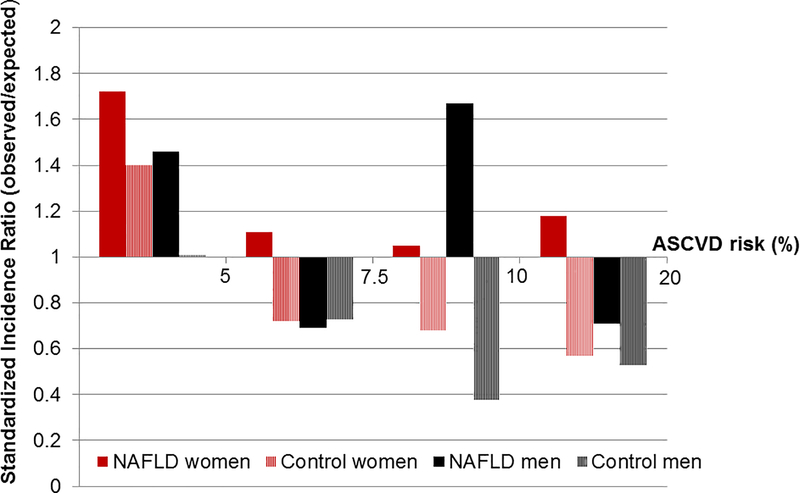
FIGURE 3. Performance of the Pooled Cohort Equations in estimating 10-year risk of myocardial infarction or stroke.
The Standardized Incidence Ratio (observed/expected rate of events) is illustrated in men and women with NAFLD compared to the general population, across strata of estimated risk (>1 represents underestimation, <1 represents overestimation of risk). The observed and predicted risks were plotted by clinical risk categories using cut points of 5%, 7.5% and 10%.

