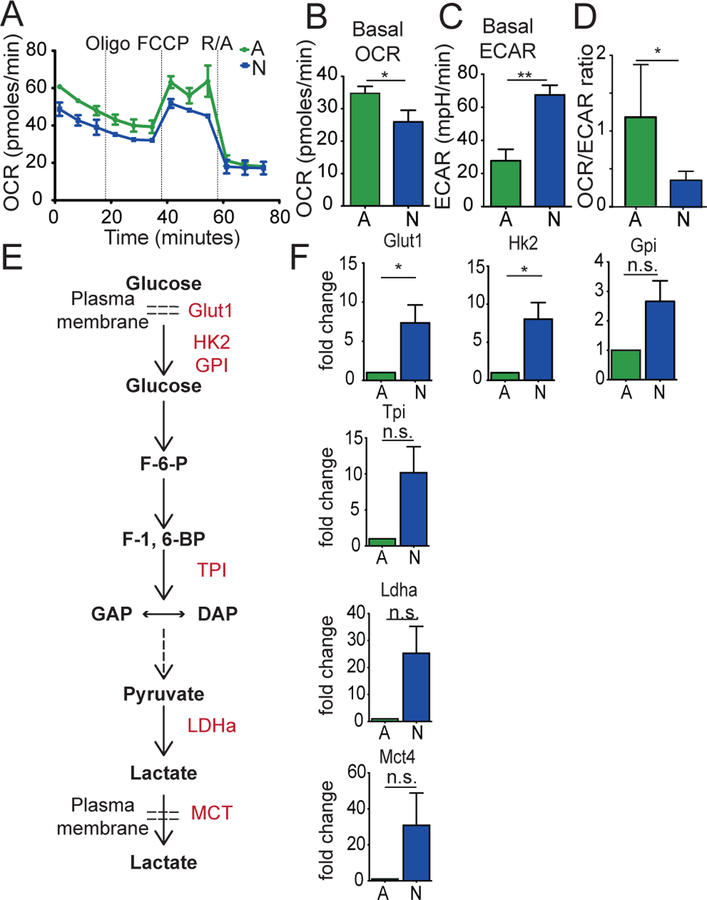
Figure 1. Neonatal CD8+ T cells exhibit higher glycolytic metabolism after in vitro stimulation.
(A) OCR measurements of adult and neonatal CD8+ T cells at 48hr after α-CD3 and α-CD28 activation. (B) Basal OCR, (C) Basal ECAR, and (D) Basal OCR/ECAR ratios in adult and neonatal CD8+ T cells at 48hr after α-CD3 and α-CD28 activation. (E) Pathway of critical proteins in glycolysis. (F) Fold change in mRNA expression of proteins 8 hours post-stimulation using qPCR. Data representative of two independent experiments with 3–5 biological replicates/group. * p<0.05, ** p<0.005 by unpaired student t-test.

