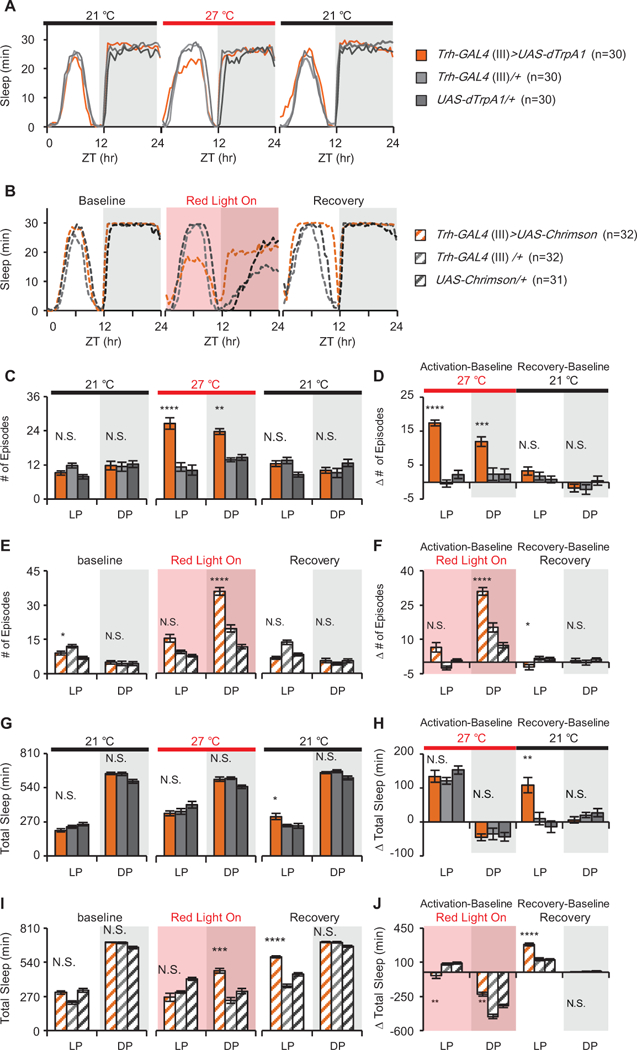
Figure 1. Activation of Trh-GAL4+ neurons fragments sleep but has no consistent effect on total amount.

Movement data captured in 1 min bins were used to extract sleep using the standard definition of a sleep bout as 5 min of inactivity [13]. Sleep profiles of baseline, activation and recovery days. The experimental genotypes, Trh>dTrpA1 (A) and Trh>Chrimson (B), are shown in orange, UAS/+ and GAL4/+ controls are in gray. Activation of Trh-GAL4 cells increases the number of sleep episodes (C and E). The change from baseline day (in minutes) is shown (D and F) for the day of activation and the recovery day. Heat activation has no significant effect on the amount of sleep compared to controls (G), while light activation causes an increase in sleep during the night (I). The change in total sleep time (minutes) compared to the baseline day for activation and recovery days shows that both heat (H) and light (J) have significant effects on total sleep in all genotypes compared to the baseline day. Throughout all figures unless specified: LP: light period; DP: dark period. ZT: Zeitgeber Time. Asterisks in the figure indicate significant differences between the experimental genotype and both GAL4 and UAS controls. *p<0.05; **p<0.01; *** p<0.001; **** p<0.0001; N.S.: not significant. Red bar and black bar indicate data collected at 27°C and 21°C, respectively. Red shade indicates data collected when red light was on. Complete statistical methods and all individual comparisons are shown in STables 2–7. See also Figure S1.
