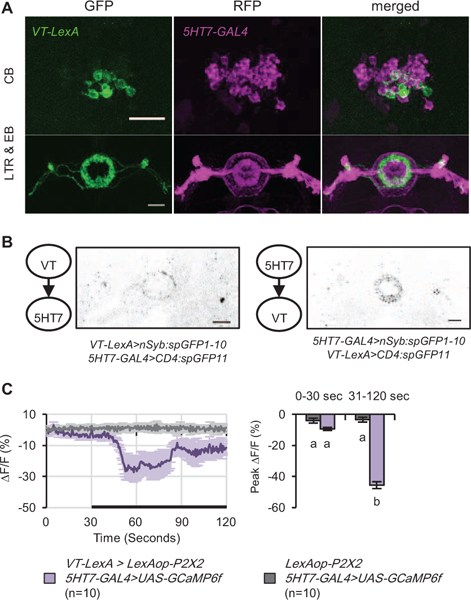
Figure 6. An intra-EB circuit controls sleep structure.

(A) 5HT7>RFP and VT>GFP cells do not overlap. (B) Reciprocal activity-dependent synaptic GRASP signals were detected between VT-LexA+ and 5HT7-GAL4+ neurons using a mAb which detects only holoGFP [54]. (C) Activation of VT-LexA+ neurons expressing P2X2 by application of ATP significantly decreased calcium levels in GCaMP6-expressing 5HT7-GAL4+ neurons. Black bar indicates ATP application. Statistically similar groups are marked by the same letter, with different letters indicating significant differences (p<0.05) between groups. See also Figure S7A-C, Videos S3.
