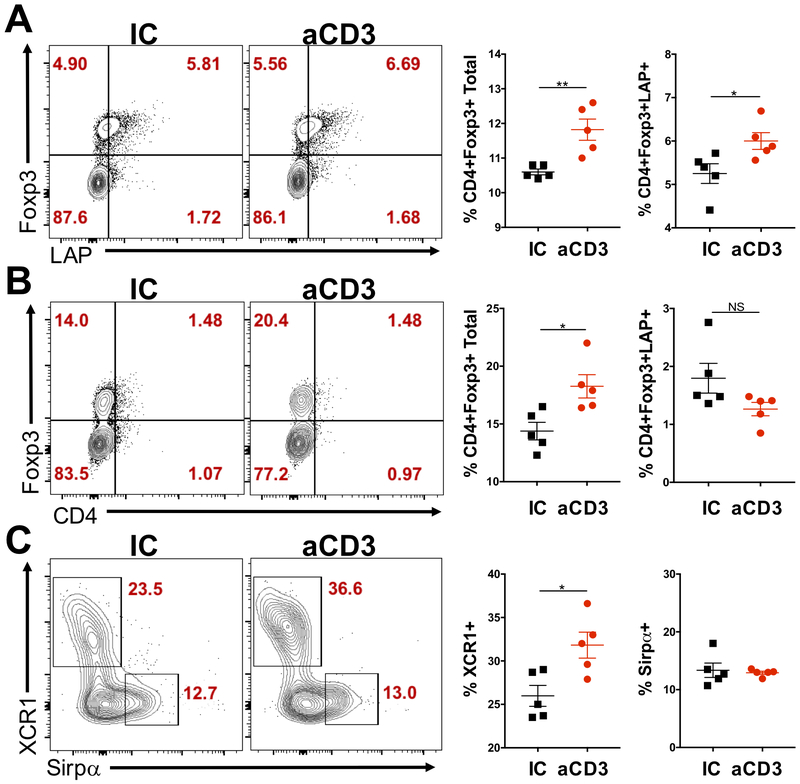
Figure 1. Increased Treg cells and cDC1s in the mLN from mice treated with oral anti-CD3.
(A-C) FACS plots and bar graphs showing Foxp3 and LAP expression in CD4+ cells from the mesenteric lymph node (mLN; A), small intestine lamina propria (SILP; B), as well as XCR1 and Sirpα on CD11c+CD103+ dendritic cells (DCs; C) in the mLN from mice treated for 5 consecutive days with 10 μg of either anti-CD3 (aCD3) or isotype control (IC); n=5 mice/group. mLN and SILP were removed 3 and 5 days, respectively, after the last dose of anti-CD3 or IC; n=5 mice/group. Data are shown as mean ± SEM and are representative of two to three independent experiments. Student’s t test was used. * p<0.05, ** p<0.01.

