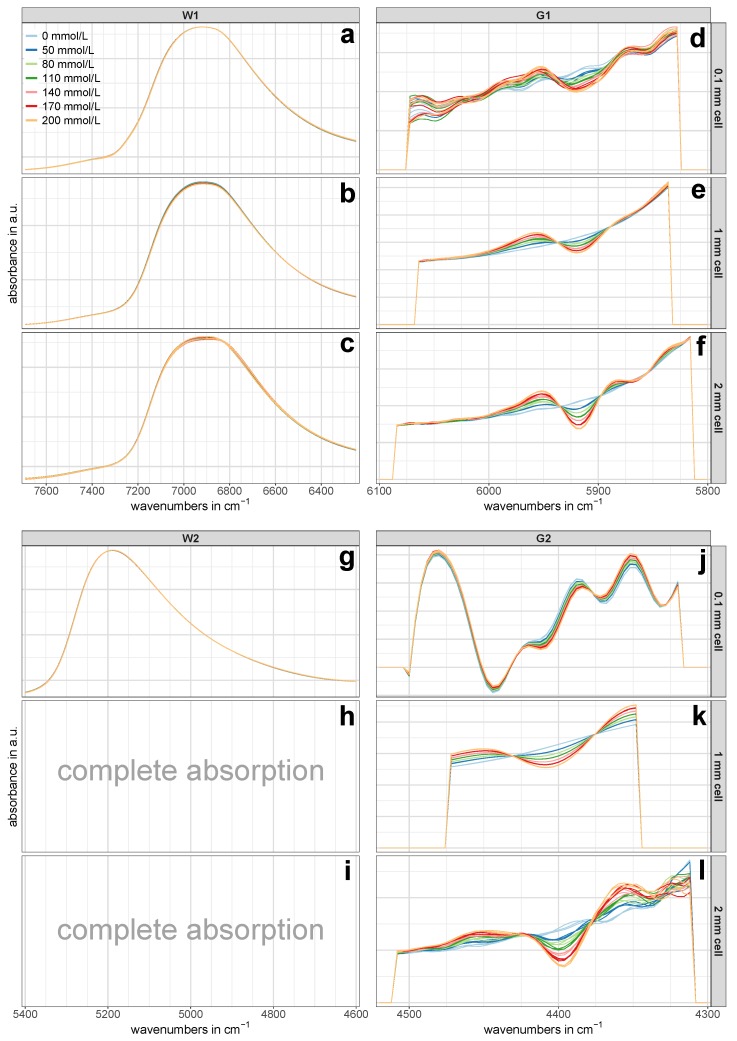
Figure 3.
Pre-treated NIR spectra of the calibration set. The spectral regions W1 (a–c), W2 (g), G1 (d–f), and G2 (j–l) are shown for all three utilized cell pathlengths separately. Each concentration is represented by three representative NIR spectra (one per batch). No spectra were available in region W2 for the 1 mm and 2 mm cells (h,i) due to the complete absorption of the NIR light.

