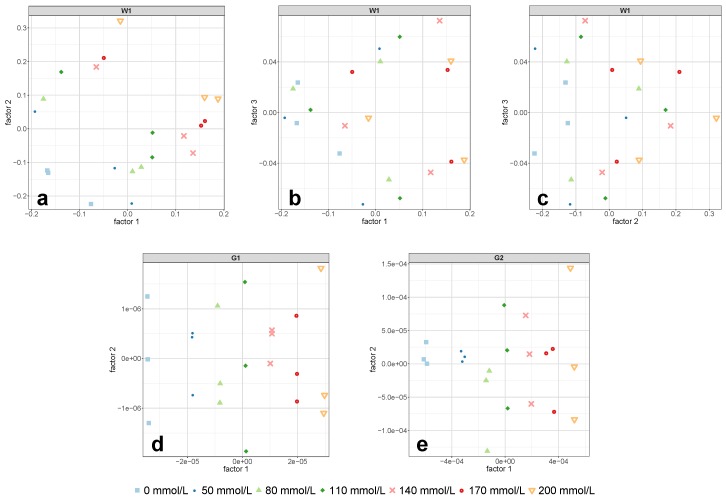
Figure 8.
PLS-R score plots of the calibration set for the regions W1 (a–c), G1 (d), and G2 (e) obtained by measurements with the 2 mm cell. Each data point corresponds to one batch. The featured factors were chosen according to the required number of PLS-R factors in Table 2.

