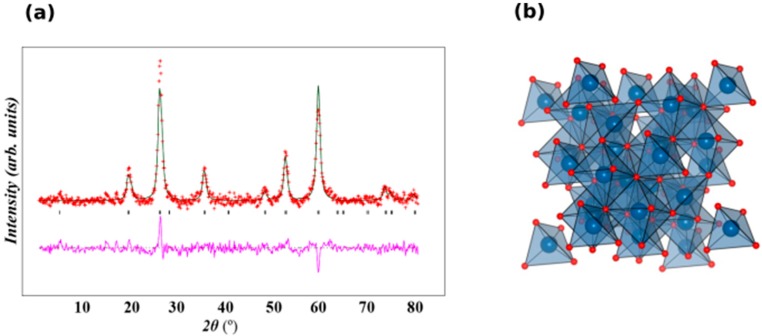
Figure 7.
(a). XRD pattern with Rietveld refinement of Fe3O4. Crosses indicate the experimental data and the calculated profile is the black continuous line. The lowest curve shows the difference between experimental and calculated patterns. The black vertical bars indicate the expected reflection positions and (b) a polyhedral view of the Fe3O4 structure. Blue and red are occupied by Fe and O respectively.

