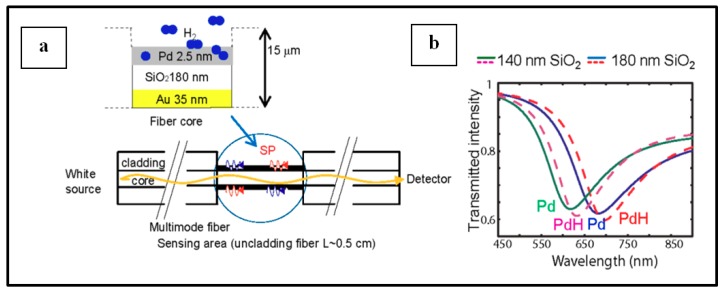
Figure 19.
(a) Schematic representation of the way the MIM structure on the fiber core, after removing the cladding. (b) The simulated transmitted intensity as a function of the wavelength for two different SiO2 thicknesses. The line and the dashed line represent respectively the metallic and the hydrogenated states. Reprinted with permission from [108] © The Optical Society

