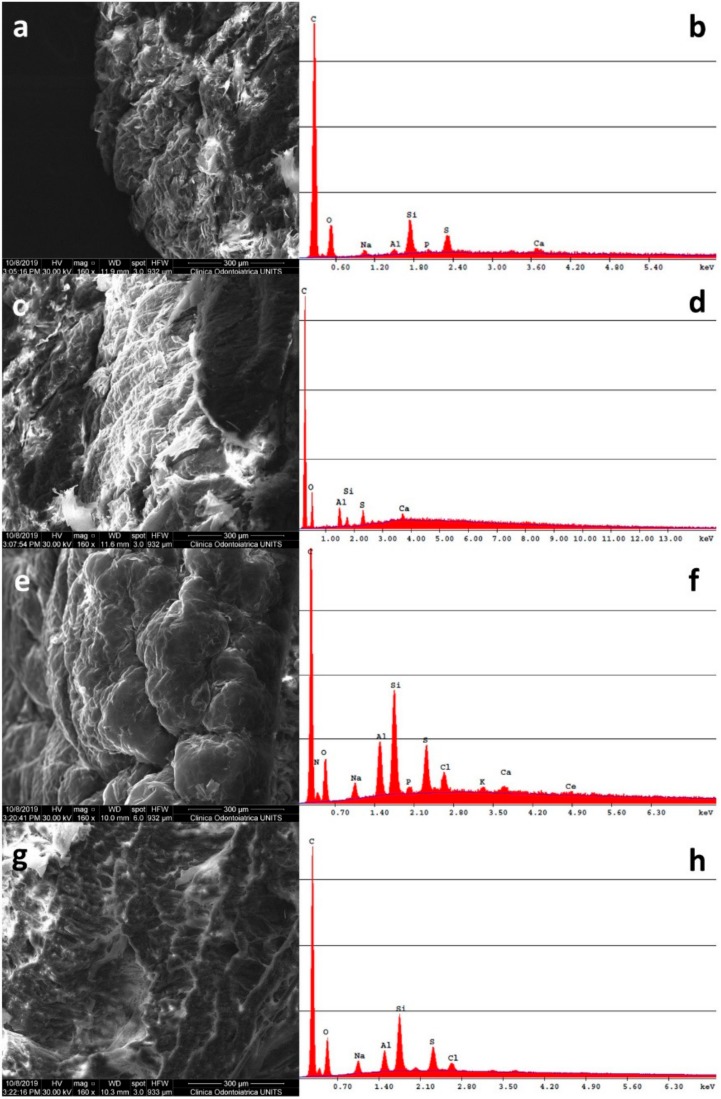
Figure 4.
Representative SEM-EDS micrographs of skin samples treated with CeO2 NPs and EDS spectra in full-frame acquisition mode: (a) epidermis of a blank cell and (b) relative EDS spectrum; (c) dermis of a blank cell and (d) relative EDS spectrum; (e) epidermis of an intact skin sample and (f) relative EDS spectrum; (g) dermis of an intact skin sample and (h) relative EDS spectrum. Bar = 300 µm for (a,c,e,g).

