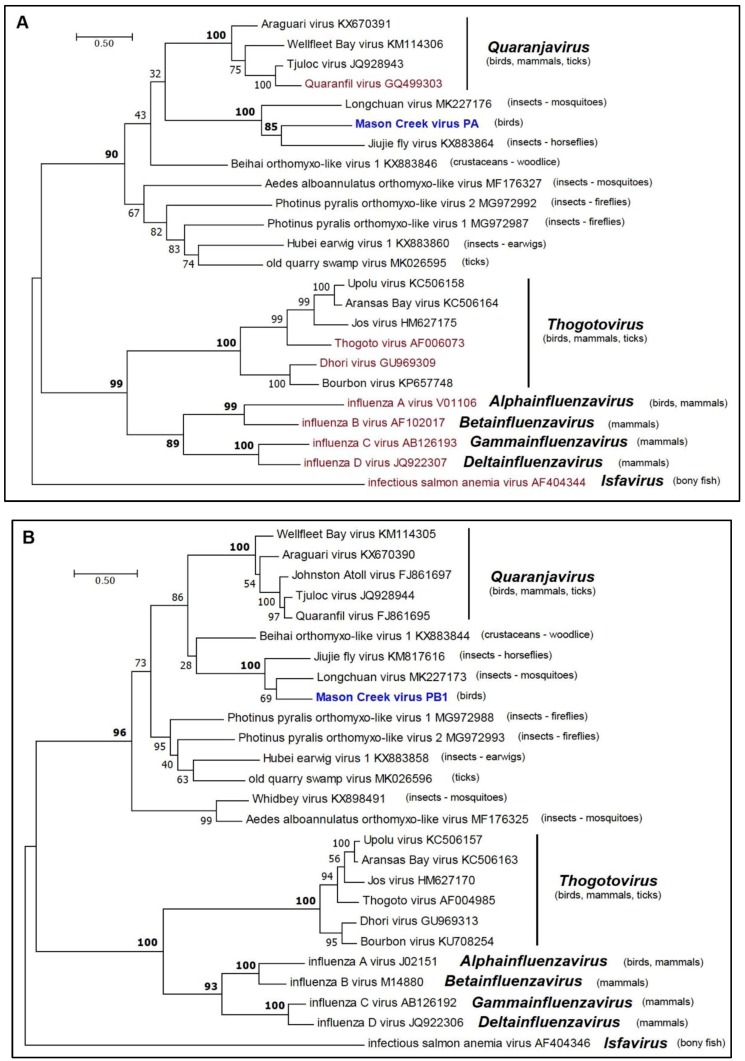
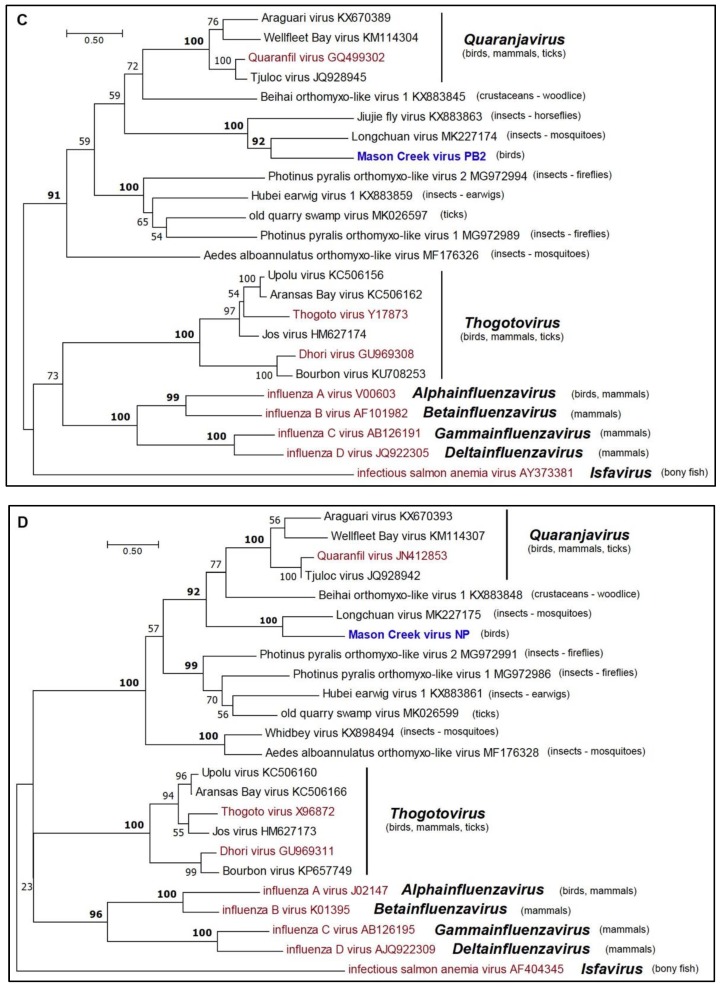
Figure 4.
Maximum likelihood phylogenetic trees for amino acid sequences of representative members of the family Orthomyxoviridae. (a) PA proteins; (b) PB1 proteins; (c) PB2 proteins; and (d) NP proteins. Branch lengths are proportional to the number of nucleotide substitutions per site. Values for bootstrap support proportion (BSP) were determined from 100 bootstrap iterations. BSP values showing strong support for each of the key nodes are shown in bold. In each tree, viruses formally assigned to species are shown in magenta and the position of MCV is shown in blue. The Genbank accession numbers of all sequences are as shown.


