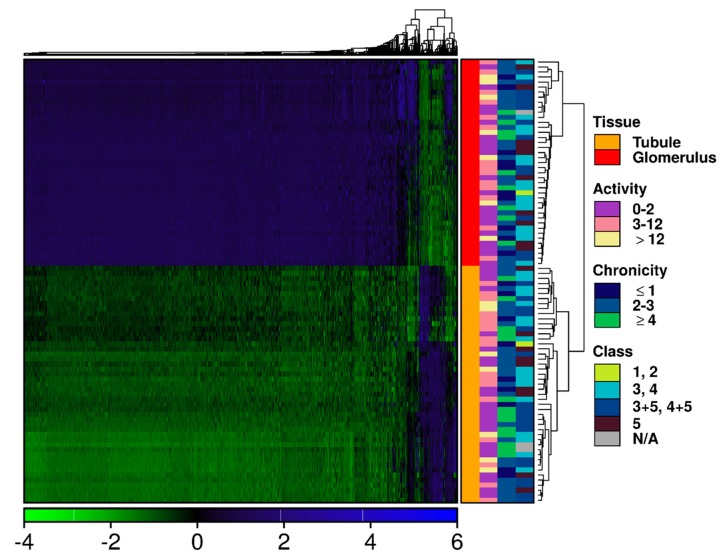
Figure 1.
Glomeruli and tubulointerstitium display divergent transcriptional profiles. Transcripts with the most variable abundance levels across the dataset were isolated. Clustering of both transcripts and samples was performed using the DIANA hierarchical clustering algorithm, with Pearson’s correlation as a similarity metric. Each column represents scaled mRNA abundance level of a single transcript, while each row represents a sample. Covariates indicate tissue compartment (glomerular vs. tubulointerstitial), categories of the NIH (National Institute of Health) activity and chronicity indices and ISN/RPS (International Society of Nephrology/Renal Pathology Society) class.

