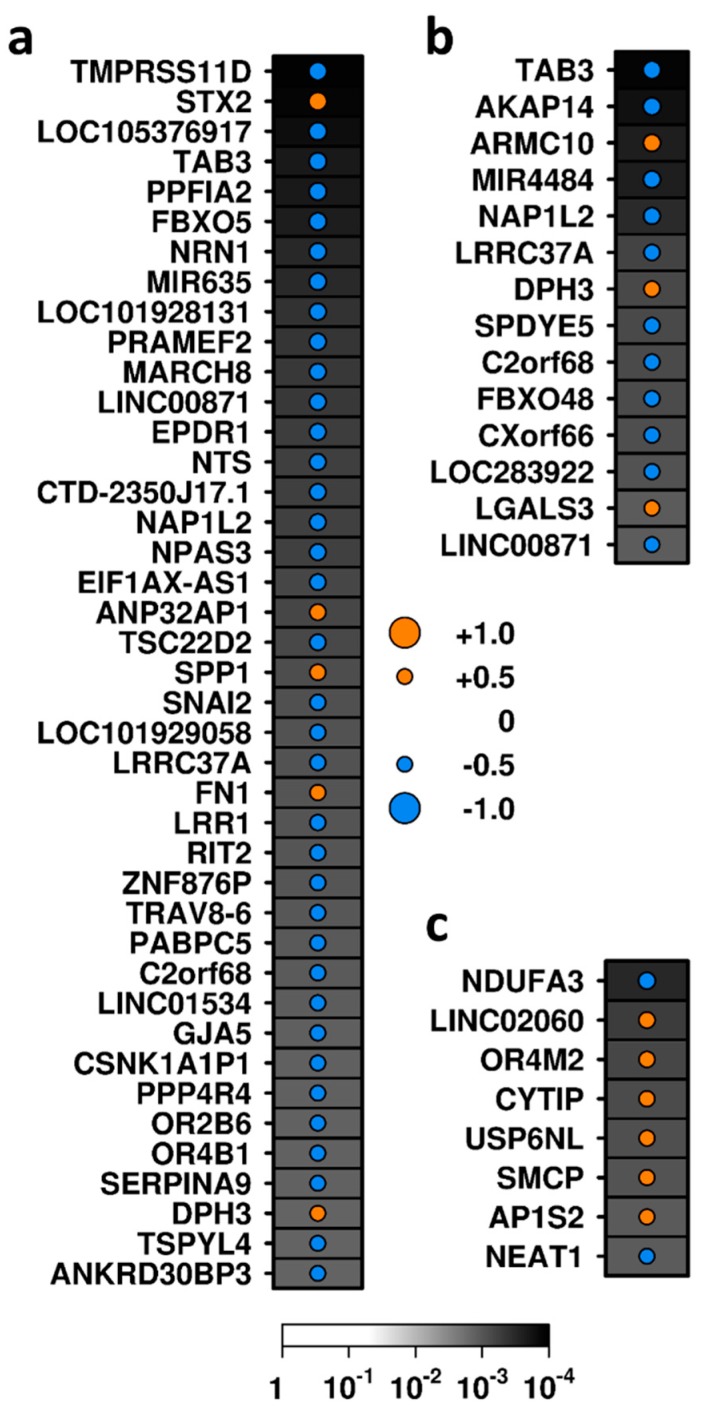
Figure 2.
Exploratory analyses: transcripts demonstrating correlations with metrics of activity and glomerular scarring using the semi-quantitative approach. Transcripts correlated with (a) endocapillary hypercellularity, (b) crescent formation, (c) Glomerulosclerosis score. Dot size indicates the size of the correlation (Spearman’s ρ); color indicates the direction of correlation; background shading indicates the significance level (unadjusted p-value). Genes are ordered according to the absolute value of correlation statistic (ρ).

