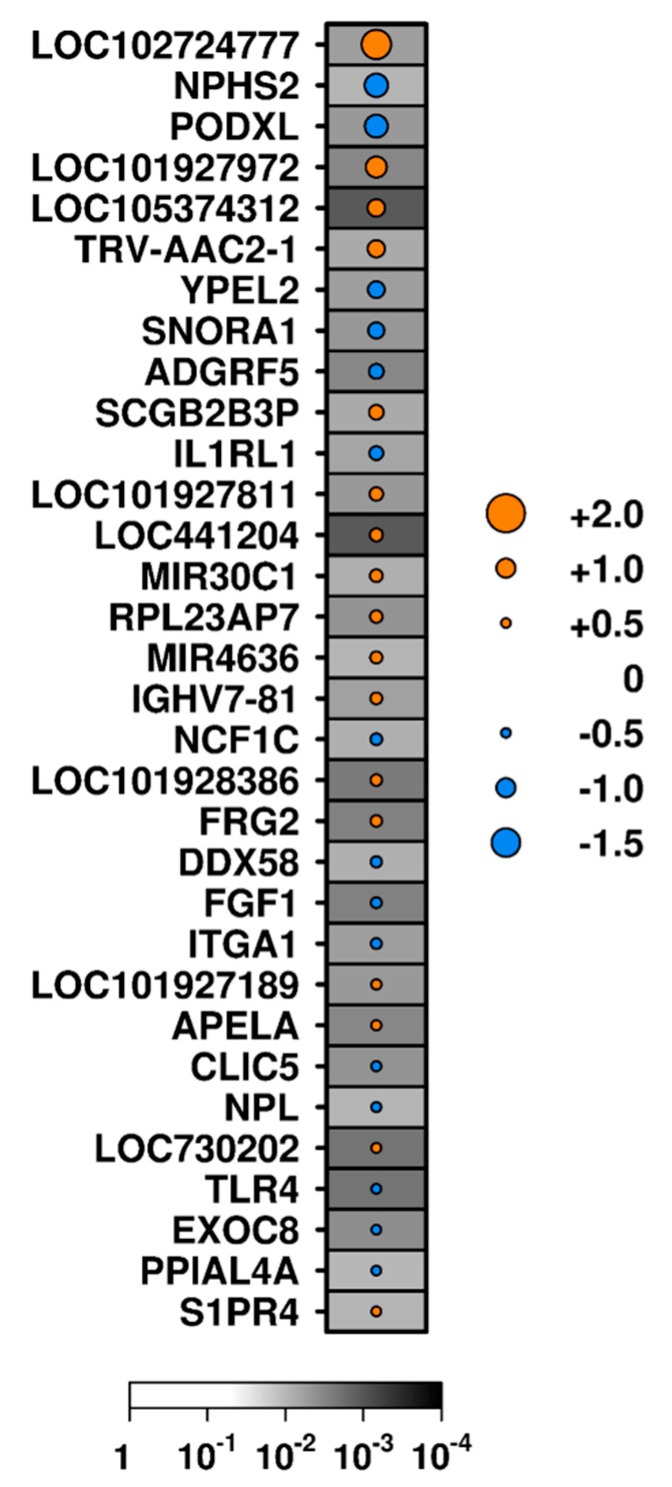
Figure 3.
Exploratory analysis: transcripts with differential abundance in patients with or without interstitial fibrosis. Dot size indicates the median difference in RNA abundance; color indicates the direction of difference (orange indicates an increase in samples with fibrosis relative to those without, while blue indicates a decrease); background shading indicates significance level (unadjusted p-value). Genes are ordered by the magnitude of difference.

