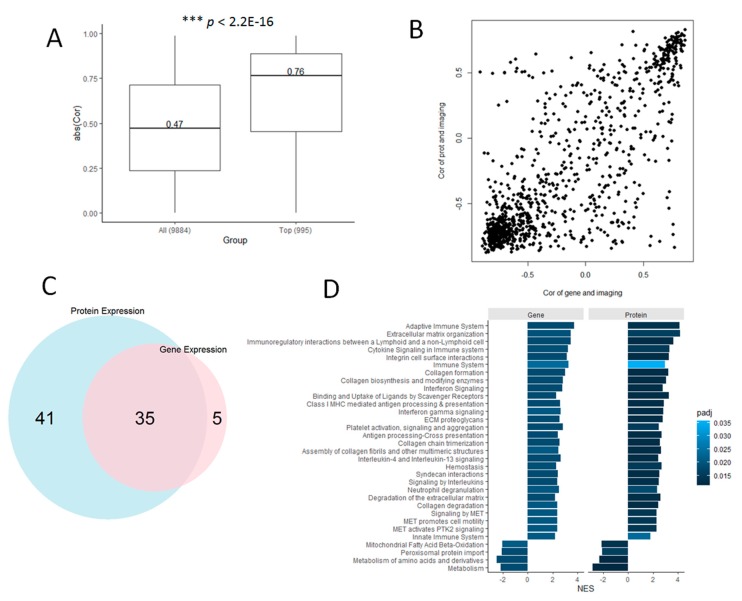
Figure 5.
Protein and gene expression data are highly concordant in the diagnosis of clear cell renal cell carcinomas (CCRCC). (A) Box plot of the gene-protein expression correlations observed in our set of 995 proteins, compared to distribution of correlation values observed in the full set of proteomics dataset with available gene expression data. (B) Correlation plot of protein expression-image prediction correlations (vertical axis) vs. gene expression-image prediction correlations (horizontal axis). (C) Number of overlapping molecular (Reactome) pathways statistically detected (with GSEA) in the protein and gene expression datasets independently, on the basis of their correlations with the image-based predictions. (D) List of significantly enriched 35 pathways shared in common by the protein and gene expression datasets. Bars indicate the magnitude of the enrichment scores, and adjusted P-values of the enrichments are color coded.

