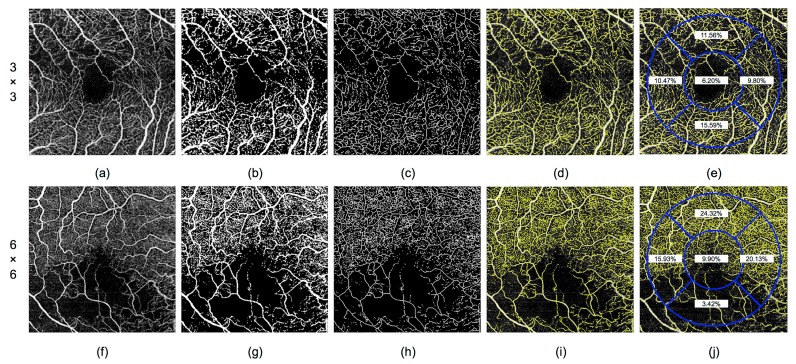
Figure 2.
Steps of the automatic analysis of the optical coherence tomography angiography (OCTA) 3 × 3 and 6 × 6 mm images (a–e and f–j, respectively) using the proposed methodology. (a,f) Original OCTA image centered on the fovea. (b,g) Thresholding. (c,h) Skeletonization. (d,i) Overlap. (e,j) Vascular density calculation for each of the five zones of the Early Treatment Diabetic Retinopathy Study (ETDRS) grid, representing the foveal and parafoveal area.

