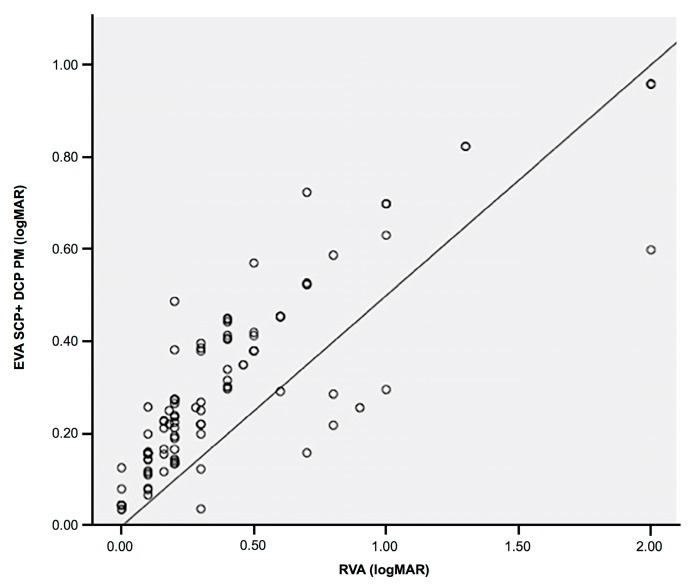
Figure 5.
Dispersion diagram showing the most accurate linear positive correlation between the estimated visual acuity (VA) when deep capillary plexus information was integrated into the proposed automatic software and the real VA of the patient. EVA: estimated visual acuity, SCP: superficial capillary plexus, DCP: deep capillary plexus, PM: proposed method, RVA: real visual acuity.

