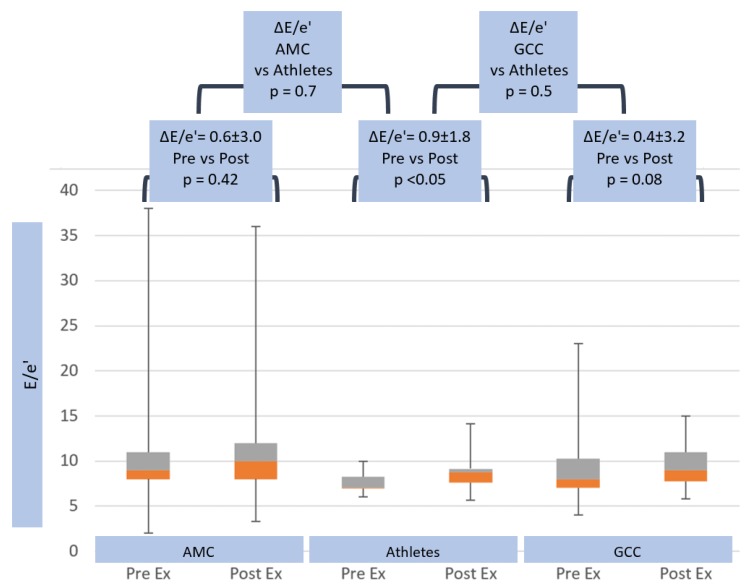
Figure 4.
Trans-mitral E/e’ response in age matched controls, athletes and general community cohort populations, pre- and post-exercise. The box and whisker plots depict the minimum, first quartile, median, third quartile and maximum values of each data set. The change in E/e’ from pre- to post-exercise is shown for the three groups, with standard deviations and p-values. The change in E/e’ between all groups is also shown, with p-value.

