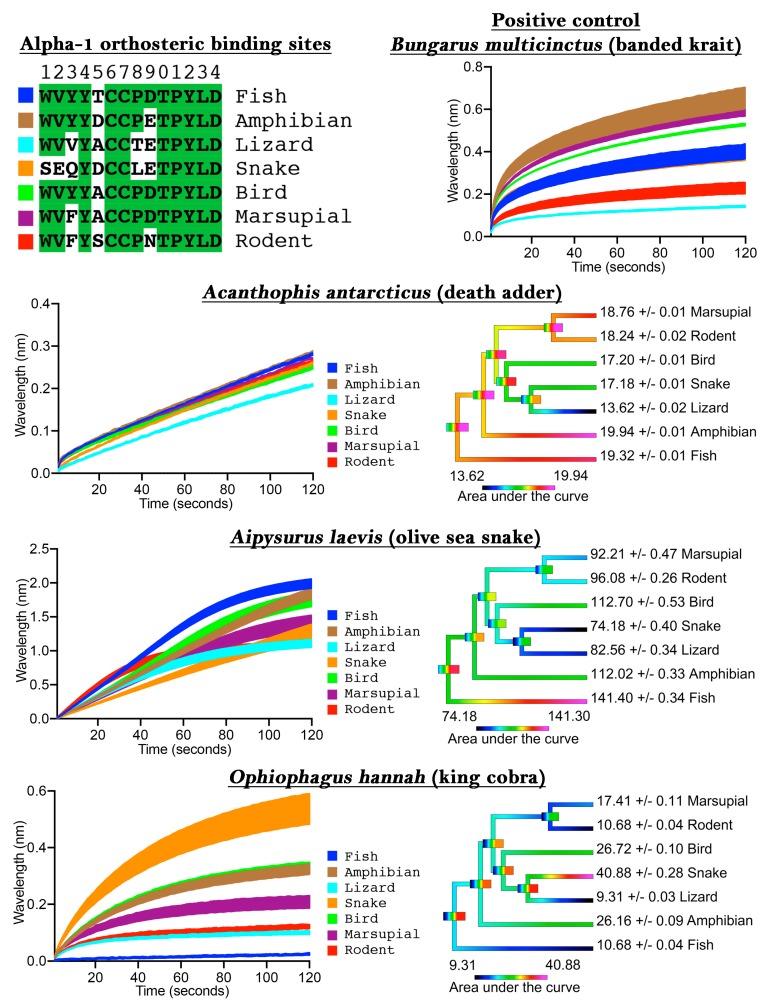
Figure 1.
Comparisons of a generalist-feeding species (Acanthophis antarcticus), a fish-prey specialist (Aipysurus laevis), and a snake-prey specialist (Ophiophagus hannah). Colored rectangles next to the orthosteric site sequences (top left image) correspond to the results for the particular target in the line graphs (B. multcinctus image and left side images of A. antarcticus, A. laevis, and O. hannah panels). Green highlights show ancestral residues. Phylogenetic tree colouring is heat mapping, with lower values colored cooler while higher values are colored warmer (right side images of A. antarcticus, A. laevis, and O. hannah panels). Note the different scale bars for each heat map. Phylogenetic tree node bars indicate ancestral state reconstruction error range, which rapidly becomes broad due to the dynamic variation in target specificity. All values are N = 3 mean and SEM, with the very small error range reflective of assay precision.

