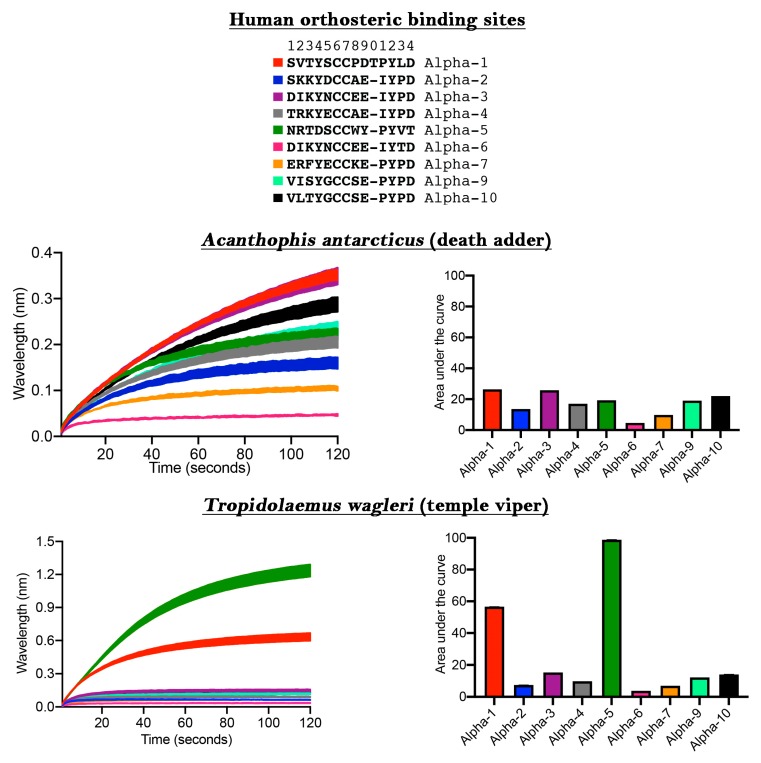
Figure 2.
Use of the method for biodiscovery screening for selective ligands of α-nicotinic acetylcholine receptor orthosteric sites. Colored rectangles next to the orthosteric site sequences (top left image) correspond to the results for the particular target in the line and bar graphs. Values are N = 3 mean and SEM, with the very small error bars reflective of assay precision.

