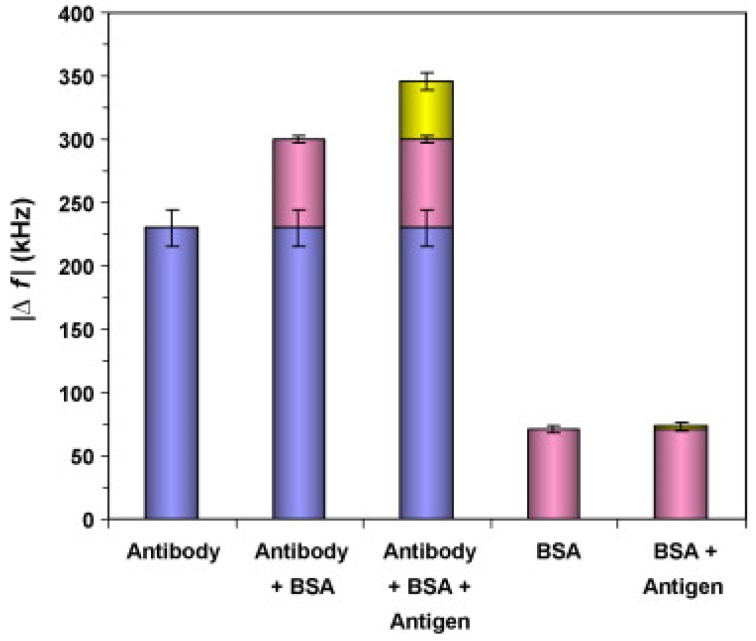
Figure 7.
The frequency shift after h-PSA antibody adsorption (5 mg/L) for 15 min was 230 kHz (1st column), then BSA blocking (50 mg/L) for 25 min leads to 70 kHz shift (2nd column) and further antigen h-PSA binding (5 mg/L) for 15 min resulted another 46 kHz shift (3rd column). In control experiments, BSA adsorption at electrode surface (50 mg/L) for 30 min leads to 71 kHz shift (4th column) and then h-PSA antigen adsorption (5 mg/L) for 15 min over BSA resulted only 2 kHz shift (5th column), along y-axis Δf represents resonant frequency shifts, adapted with permission from [161].

