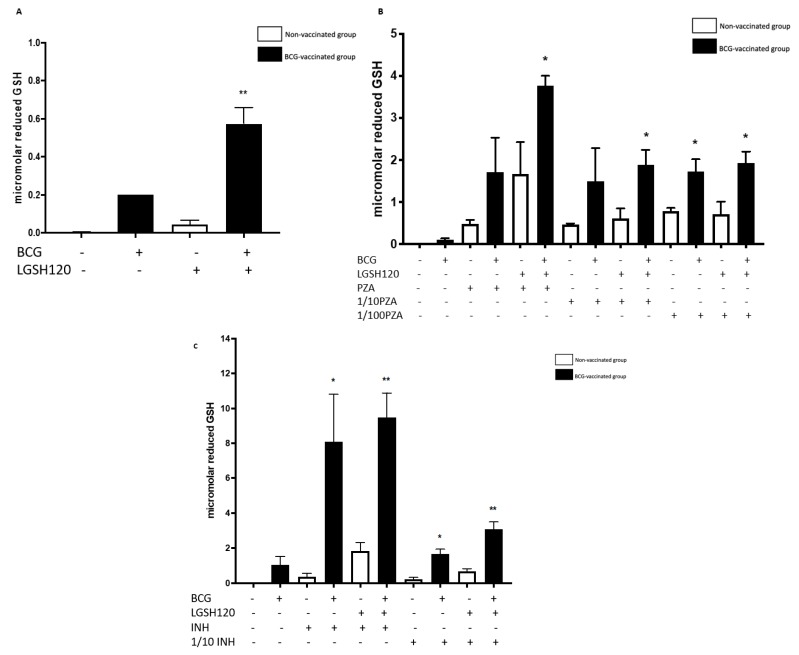
Figure 2.
Levels of reduced GSH in PZA and INH treated granulomas. The GSH assay was performed by the colorimetric method using an Arbor Assays kit. (A) Comparison of reduced GSH levels in non-vaccinated and BCG-vaccinated groups; (B) GSH measurements in PZA treated granulomas from non-vaccinated and BCG-vaccinated subjects. Data represents ±SE from experiments performed from 14 different subjects. The p value style consisted of 0.1234 as not significant, 0.0332 with one asterisk (*), 0.0021 with two asterisks (**), 0.0002 with three asterisks (***), and less than 0.0001 with four asterisks (****). (C) The GSH assay was performed by the colorimetric method using an Arbor Assays kit. GSH measurements in INH treated granulomas from non-vaccinated and BCG-vaccinated subjects. Data represents ± SE from experiments performed from 14 different subjects. Analysis of figures utilized a one-way ANOVA with Tukey test. The p value style consisted of 0.1234 as not significant, 0.0332 with one asterisk (*), 0.0021 with two asterisks (**), 0.0002 with three asterisks (***), and less than 0.0001 with four asterisks (****).

