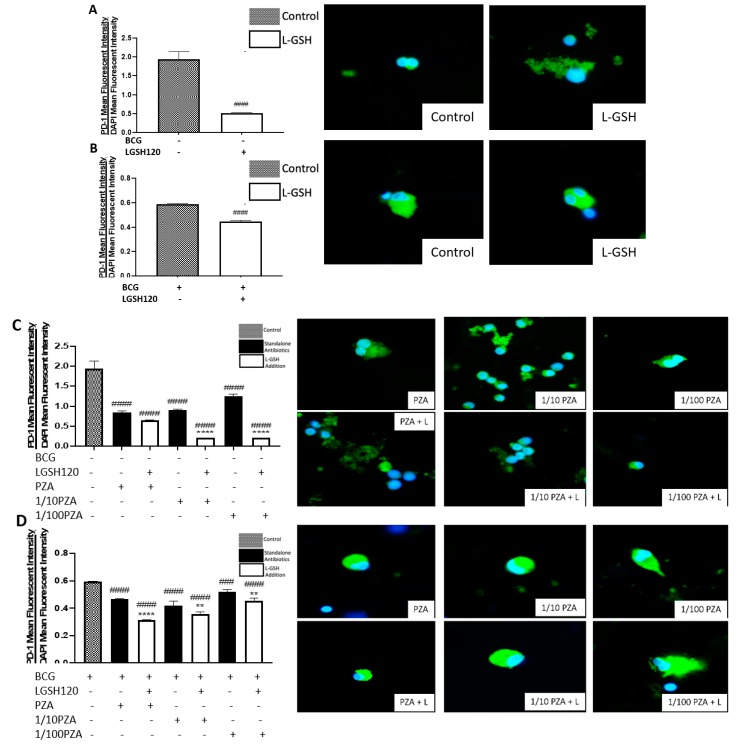
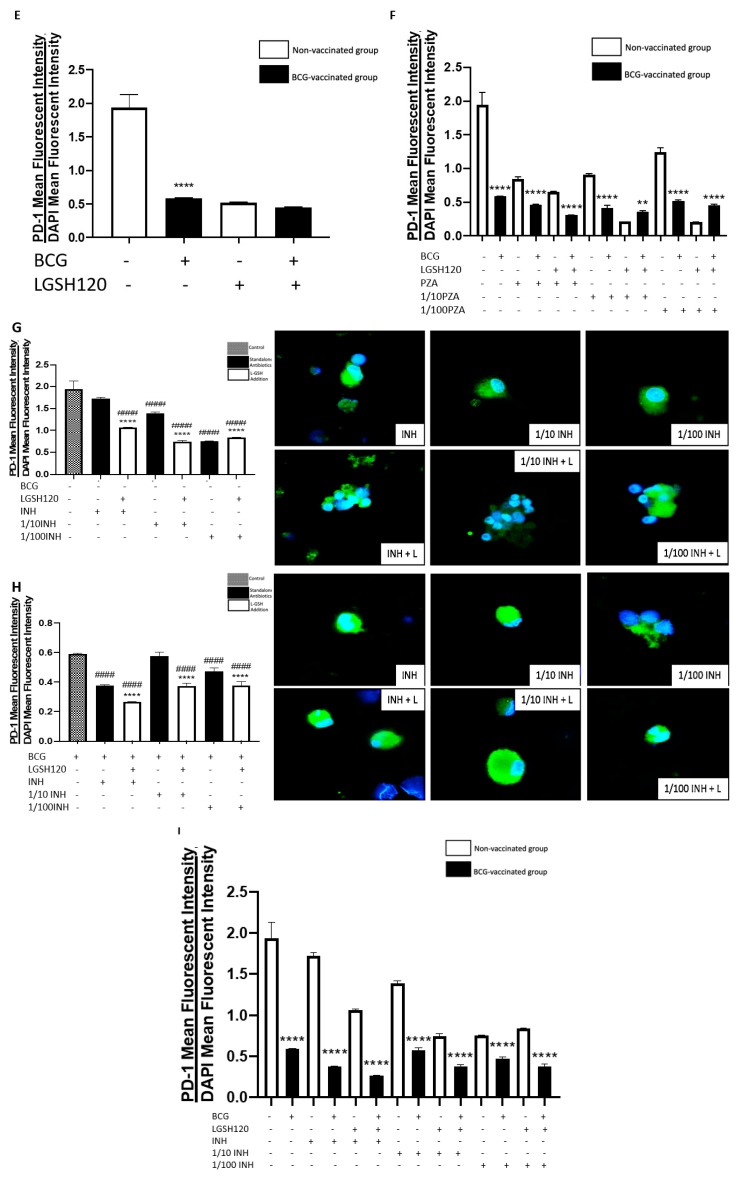
Figure 5.
Expression of programmed death receptor 1 (PD-1) in PZA treated granulomas. PD-1 T cells were measured with an anti-PD1 primary monoclonal antibody conjugated with HRP. A secondary anti-mouse PE-Cy5 antibody was added after blocking with 0.1% Triton X for 1 h. The nuclei of cells were stained with DAPI. The mean fluorescence of PD-1 was corrected with the mean DAPI fluorescence. (A) PD-1 mean fluorescence from non-vaccinated subjects with L-GSH treatment along with PD-1 fluorescent images; (B) PD-1 mean fluorescence from BCG vaccinated subjects with L-GSH treatment along with PD-1 fluorescent images; (C) PD-1 mean fluorescence with PZA, 1/10 PZA, and 1/100 PZA treatment in the presence or absence of L-GSH in non-vaccinated subjects; (D) PD-1 mean fluorescence with PZA, 1/10 PZA, and 1/100 PZA treatment in the presence or absence of L-GSH in BCG-vaccinated subjects; (E) PD-1 mean fluorescence in non-vaccinated and BCG-vaccinated groups with sham treatment and L-GSH treatment; (F) PD-1 mean fluorescence in non-vaccinated and BCG-vaccinated groups with PZA treatment. Data represents ± SE from experiments performed from 14 different subjects. An unpaired t-test with Welch corrections was used in Figure (A). Analysis of Figures B–F utilized a one-way ANOVA with Tukey test. The p value style consisted of 0.1234 as not significant, 0.0332 with one asterisk (*), 0.0021 with two asterisks (**), 0.0002 with three asterisks (***), and less than 0.0001 with four asterisks (****). A hash mark (#) indicates categories compared to the control, and an asterisk indicates categories compared to the previous category directly before it. (G) PD-1 mean fluorescence with INH, 1/10 INH, and 1/100 INH treatment in the presence or absence of L-GSH in non-vaccinated subjects; (H) PD-1 mean fluorescence with INH, 1/10 INH, and 1/100 INH treatment in the presence or absence of L-GSH in BCG-vaccinated subjects; (I) PD-1 mean fluorescence in non-vaccinated and BCG-vaccinated groups with INH treatment. Data represents ± SE from experiments performed from 14 different subjects. Analysis of figures utilized a one-way ANOVA with Tukey test. The p value style consisted of 0.1234 as not significant, 0.0332 with one asterisk (*), 0.0021 with two asterisks (**), 0.0002 with three asterisks (***), and less than 0.0001 with four asterisks (****). A hash mark (#) indicates categories compared to the control, and an asterisk indicates categories compared to the previous category directly before it.


