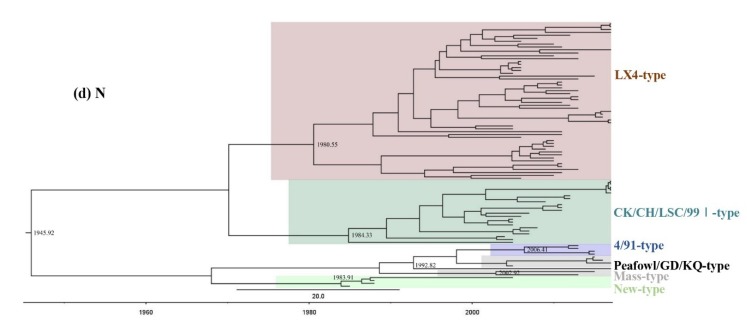
Figure 5.
Time-resolved phylogenetic tree of the (a) S1, (b) E, (c) M, and (d) N genes of IBV using the Bayesian MCMC method (see Materials and Methods for further details). The MCC tree was constructed with 10% burn-in by Tree Annotator version 1.8.2 implemented in the BEAST software package. A change in branch color indicates a time change during the genotype’s evolutionary history. Numbers beside the branches are branching time. The scale bar represents the unit of time (year).


