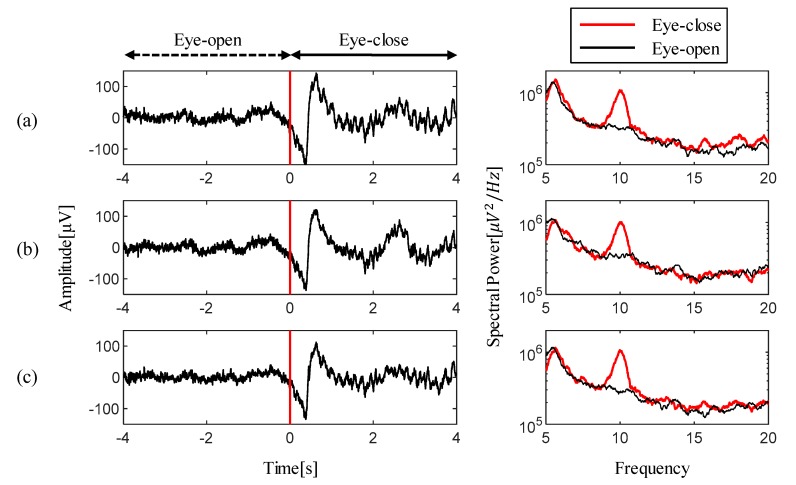
Figure 5.
EEG measurements and their spectral comparisons for (a) proposed 2-wired active dry electrode, (b) alternative 3-wired active dry electrode, and (c) passive dry electrode. On the left, the red vertical line on the EEGs indicate the task onset timing for the eye-close instructions. During the eye-close session, activated alpha waves are commonly observed in the time-series and spectral visualization results for all types of electrodes.

