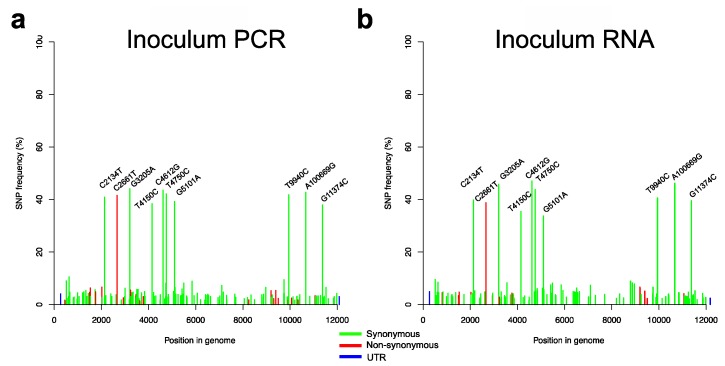
Figure 2.
Single nucleotide polymorphism (SNP) frequency plots of the challenge virus in the inoculum. SNPs with a frequency above 20% are indicated for each sample type as follows: (a) Virus inoculum (determined following RT-PCR), and (b) virus inoculum (determined directly from the RNA). The red, green and blue colours of the bars represent non-synonymous, synonymous and untranslated region (UTR) mutations, respectively.

