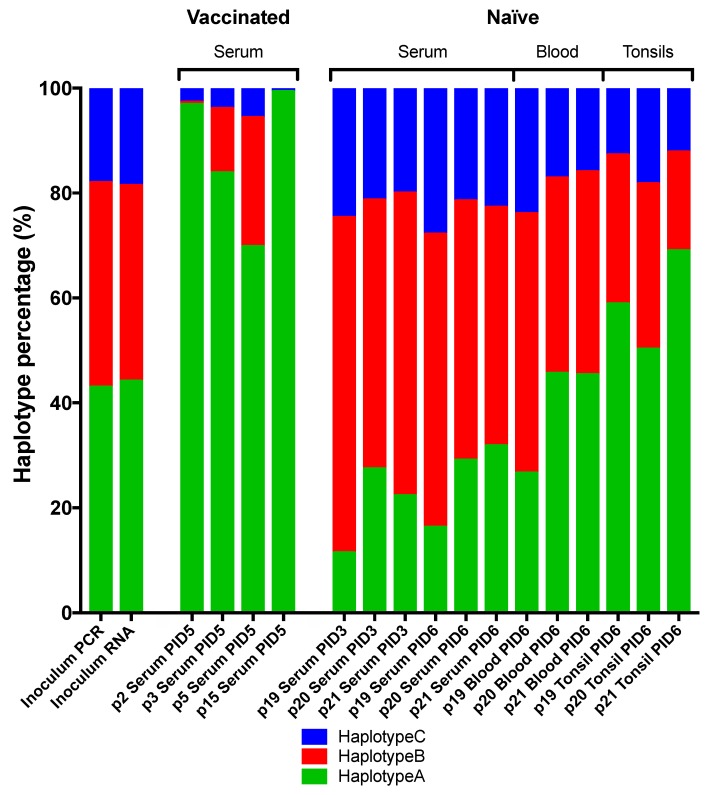
Figure 6.
Haplotype distribution in virus populations of all samples across the complete ORF. Stacked bar diagram showing the percentage distribution of haplotype A (C2661T (aa S763L), G3205A, C4612G, T4750C, T9940C, and A10669G), B (C2134T, T4150C, G5101A, and G11374C), and C (Koslov consensus), respectively. Haplotype distribution was calculated for each sample as the average of all SNPs constituting the haplotype A or B and summed. The remaining percentage, subtracted from 100%, was inferred to constitute haplotype C.

