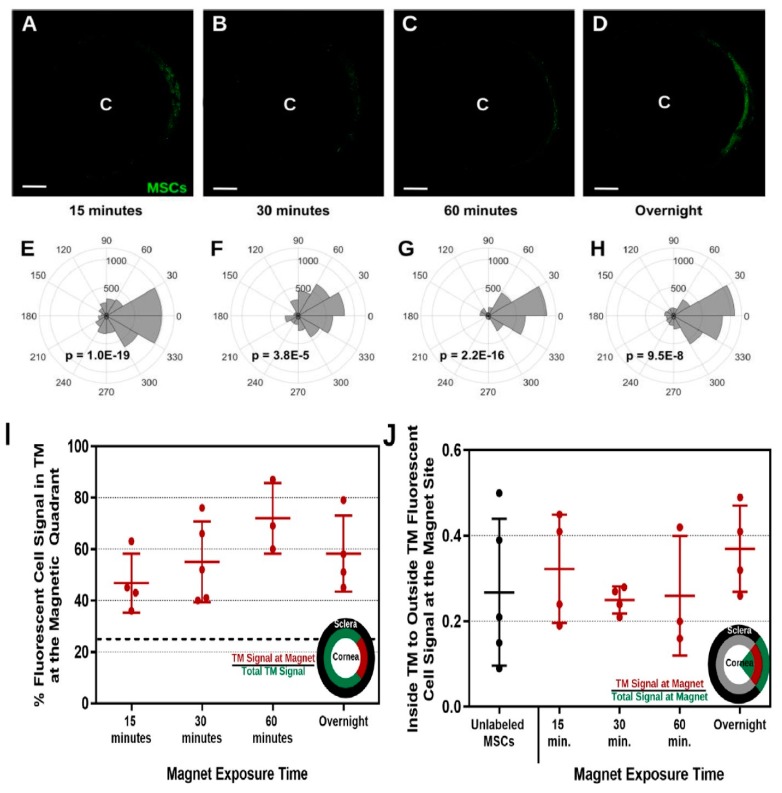
Figure 9.
Outcome of Magnetic Field Exposure Time on directing 200 nm PBNC-MSCs to the trabecular meshwork. Figure (A–D) Shows anterior segment of the eye post mesenchymal stem cell delivery. There were bar magnets around the limbal region with *C* indicating the center of the human cornea. Figure (E–H) shows the intensity of total fluorescence within the trabecular meshwork area. P-values were calculated by means of Kuiper’s V test to evaluate if distribution was non-uniformly skewed in the direction of the focus of the magnet (0°). (A,E) 15 mins (n = 4 eyes), (B,F) 30 mins (n = 5 eyes), (C,G) 60 mins (n = 3 eyes), and (D,H) overnight (n = 4 eyes) with its exposure to the magnet are presented. Figure (I) indicates the percentage of fluorescent cell signal in magnetic quadrant in the trabecular meshwork, defined as the section encompassing 45° to −45°. The dotted line designates the expected value should there have been uniform cell delivery to the entire circumference of the TM (25%). Figure (J) Trabecular region fluorescence signal in comparison with non-trabecular fluorescent signal within the zone encompassing −45° to +45°. All evaluations between groups were not significant (p > 0.05) using one-way ANOVA with post hoc Tukey survey. Adapted from [165] with permission from Scientific Reports.

