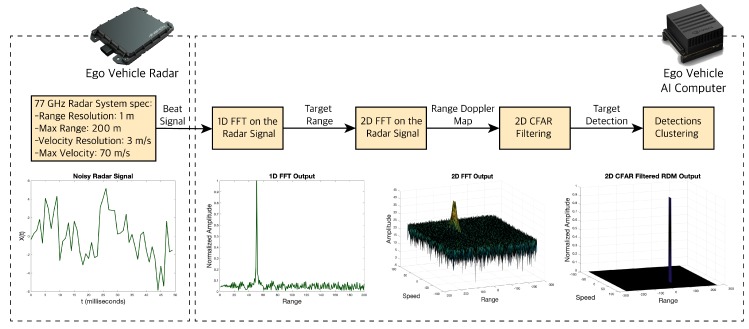
Figure 9.
Radar data processing pipeline. Plots from left to right: Noisy radar beat signal, output of the 1D-FFT showing a detection with its range, output of the 2D-FFT showing a detection with its range and Doppler velocity, and output of the 2-Dimensional Constant False Alarm Rate (2D-CFAR) filtering showing the detection with noises filtered out.

