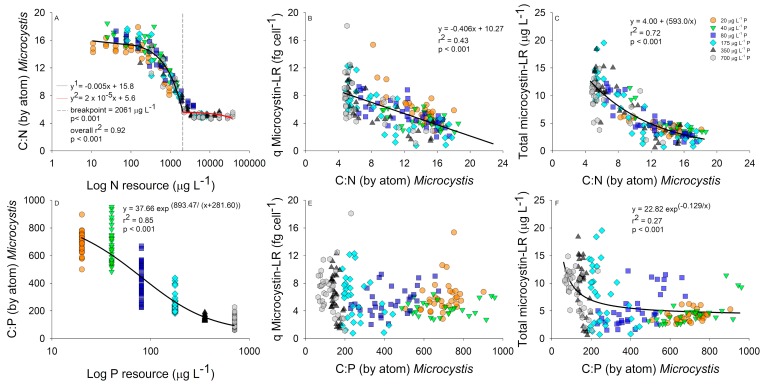
Figure 3.
Carbon to nitrogen (C:N) stoichiometry relationships with log resource N concentrations (µg L−1); (A) and microcystin cell quota (fg cell−1); (B) and total microcystin-LR (µg L−1); (C). C:phosphorus (P) stoichiometry relationships with log resource P concentrations (µg L−1); (D) and microcystin-LR cell quota (fg cell−1); (E) and total microcystin-LR (µg L−1); (F). Regressions performed using all data and color coded by P concentration (20 µg L−1 P, orange circle; 40 µg L−1 P, green triangle; 80 µg L−1 P, blue square; 175 µg L−1 P, cyan diamond; 350 µg L−1 P, black triangle; and 700 µg L−1 P, grey hexagon).

