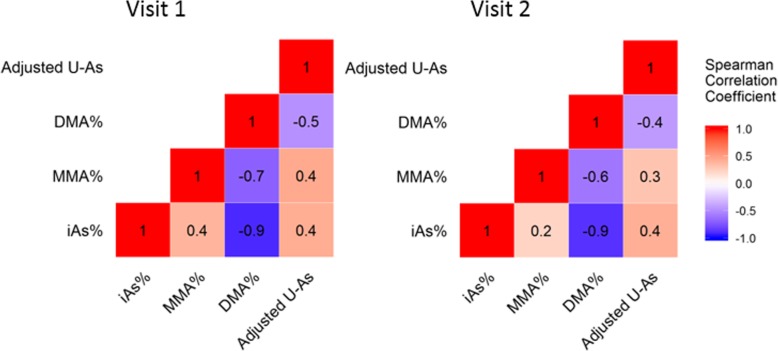
Fig. 2.
Spearman correlation coefficients for arsenic metabolites at visit 1 and 2. [Figure legend: The unit of adjusted U-As is μg/g-creatinine, and the unit of iAs%, MMA% and DMA% are all “%”. All Spearman correlation coefficients had p < 0.01. The number of participants at visit 1 is 1605, while the number of participants at visit 2 is 1443]

