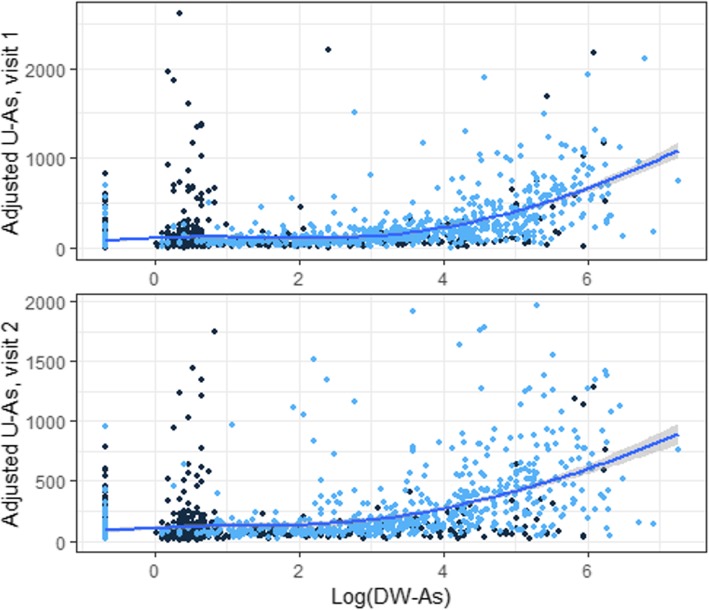
Fig. 3.
Scatter plot of adjusted U-As over log-transformed DW-As. [Figure legend: Adjusted U-As (unit of adjusted U-As: μg/g-creatinine) was plotted over log-transformed DW-As (unit of DW-As: μg/L), showing the correlation between environmental arsenic exposure and arsenic excretion. We applied Loess local polynomial linear regression to fit a solid curve line with the shade of standard error. Dark blue dots indicate observations in Sirajdikhan; light blue dots indicate observations in Pabna]

